Study of How Online Celebrities Shape Taiwanese Fashion Industry?
July 12, 2022
Assessing The Challenges Faced By The Medical Laboratory For ISO 15189, Accreditation In The Gozo General Hospital
July 12, 2022
In the intricate dance of numbers and narratives, financial analysis unveils the silent melodies of economic symphonies, transforming raw data into a compelling story of fiscal health and strategic possibilities.
Outline
- Contribution of Factors to the Management of Projects
- Financial Evaluation
- Cost Factors
- Commercial Factors
- Financial Statement Analysis
- Conclusion
- References
- Appendices
Navigating the ever-evolving business environment requires a keen sense of decision-making. At the heart of this strategic journey lies the indispensable tool of financial analysis, a gateway to comprehending the intricate tapestry of a company's financial well-being. Regardless of your role—be it investor, manager, or entrepreneur—grasping the nuances of financial analysis is pivotal. It is the key that unlocks the concealed insights buried within the numerical data, providing a holistic perspective on a company's fiscal vitality.
Explore More About Financial Analysis
In the dynamic realm of business, where uncertainty and risk abound, the ability to make well-informed decisions stands as a linchpin for success. Financial analysis serves as a guiding light, offering a panoramic view of a company's financial landscape. Whether you're navigating the complexities of investments, steering the operational ship as a manager, or charting the course as an entrepreneur, a nuanced understanding of financial analysis is the compass that leads you through the maze of numbers, uncovering the concealed truths that hold the potential to shape your strategic endeavours.


Contribution of Factors to the Management of Projects
Project management success hinges on effective leadership, clear planning, adaptability, financial acumen, technological tools, and a supportive organizational culture. These factors synergize to navigate complexities, ensuring efficient and successful project outcomes.
Financial Factors–Positive Side
Project financial considerations encapsulating the project budget and its components—appraisal, execution, and conclusion—are fundamental from project initiation. A systematic approach to financial management is pivotal, involving control and record-keeping to ensure transparency among stakeholders, including executors and donors. Utilizing systems like PeopleSoft financials, Oracle financials, or SAP enhances efficiency, facilitating accurate tax payments and minimizing disputes. The structured system keeps stakeholders well-informed about project progress. It contributes to time-saving through rapid transaction recording, precise documentation, and the generation of insightful management reports for comprehensive project evaluation (Kerzner and Kerzner, 2017). Assigned expertise is crucial for effective system operation, underscoring the importance of responsibility in the seamless integration of financial management within project frameworks.
Financial Factors–Negative Side
Projects necessitate a substantial infusion of funds, often requiring significant initial capital. Financial needs extend across various project phases, including execution, performance, and control. Insufficient funds can result in project interruptions or delays, emphasizing the critical role of securing finance. Funding sources encompass both internal and external channels.
Various financing options cater to diverse project needs, such as equity, debt, debentures, retained earnings, term loans, working capital loans, and venture funding. Long-term sources range from equity shares, retained earnings, preference shares, term loans, debentures, and government support to international financing through Euro issues, ADR, GDR, and foreign currency loans. Medium-term finance avenues include preference shares, debentures, lease finance, hire purchase finance, and medium-term loans from financial institutions, government, and commercial banks. Short-term funding options encompass trade credit, working capital loans, fixed deposits, customer advances, factoring services, and bill discounting (Harrison and Lock, 2017).
The absence of adequate finance poses a dual threat to projects, potentially leading to discontinuation and compromising the progress achieved thus far. Securing diverse financial sources is integral to ensuring the seamless execution and completion of projects.
Financial Evaluation
Beyond the previously highlighted advantages and drawbacks, it's imperative to underscore the significance of financial assessment. A thorough evaluation is essential to gauge a project's impact on the organization's sales, overall profitability, and share price. This scrutiny involves intricate calculations, including determining the payback period, Net Present Value (NPV), and Internal Rate of Return (IRR). These metrics provide a comprehensive understanding of the project's financial viability and its potential contribution to the organization's overarching financial goals.
The payback period is calculated as follows:
Payback period = | Initial outlay | (in years) |
Annual profit |
Net Present Value is calculated as:
Present values of cash inflows - the present value of cash outflows
The internal Rate of Return is calculated as:
Discount factor at which present value of cash inflows = present value of outflows
Each assessment method possesses its unique strengths and limitations. The payback period, for instance, overlooks the impact of discount rates and the time value of money. On the other hand, the Internal Rate of Return (IRR) fails to account for the term period of return. It's crucial to recognize that project evaluations extend beyond financial considerations, encompassing non-financial factors that profoundly influence project management. Elements like the availability of raw materials, power, essential amenities, motivation, location, technology, environmental factors, and personnel dynamics all play pivotal roles in shaping the success of a project. Balancing financial and non-financial considerations is essential for a comprehensive and well-informed project management approach.
Cost Factors
Effective management is paramount in determining the success of a project. Even a well-funded project can face failure with poor management, risking the invested capital. Numerous factors contribute to inadequate management, including a lack of mutual understanding and communication among team members, faulty planning leading to deviations, and shortcomings in problem identification and resolution strategies (E.U.) (Larson and Gray, 2013). Alterations in design can also impact costs, as innovations or additions necessitate additional time and effort from project members. Service providers involved in the project may charge extra for increased time input, while suppliers may adjust prices for the expanded supply of goods and materials (E.U). This highlights the critical role of proficient management in steering a project to success.
Cost Management-Positive Side
Effective and robust management can transform an otherwise mediocre project into a success, generating profits for the organization and delivering returns on investment. Additionally, when a project extends its reach to international realms, fluctuations in the forex market introduce challenges and potential benefits contingent upon implementing prudent hedging strategies. Sourcing services or materials from member countries introduces the variable of exchange rate dynamics, posing challenges or yielding gains depending on strategic management. Furthermore, adept cost management is exemplified through contracts with pre-specified, detailed cost breakdowns. This approach is a protective shield, ensuring that later cost fluctuations do not adversely impact the project (Schwalbe, 2015). This underlines the pivotal role of effective management in steering a project towards success, especially in the face of dynamic external factors.
Commercial Factors
Commercial factors encompass a spectrum of elements that significantly influence business operations. These factors include market dynamics, competition, regulatory environments, and economic conditions. Understanding and navigating these commercial considerations are vital for strategic decision-making. Successful businesses adeptly analyze these factors to formulate effective plans, stay resilient in the face of challenges, and capitalize on emerging opportunities. From market trends to legal frameworks, commercial factors are integral in shaping a company's trajectory and determining its success in the dynamic business landscape.
Listed below are the commercial factors that exert influence on project management.
Commercial Factors–Negative side
The economic landscape, both globally and within a nation, significantly influences project management. Events like wars, strikes, terrorist attacks, political upheavals, and protests can render the global market inaccessible. Long-term devaluation of currency poses a challenge to major commercial enterprises, impacting the flow of project management. This systematic risk lies beyond human control, necessitating precautionary measures (Nixon, Harrington, and Parker, 2012, p.204). Intricately tied to commercial factors, finance is a pivotal element in project management. Securing necessary funds, managing gearing, addressing tax liabilities, handling reimbursements, capital investments, loan interest payments, and dividends to stakeholders become challenging without effectively managing the aforementioned commercial factors.
Commercial Factors–Positive side
However, the movement of the interest rates can be managed using swaps (a type of derivative) if the loan is obtained for the project. Interest rate swaps (IRS) are available in the market with fixed and floating rates. The tax liabilities can also be controlled by replicating the cash flows using the financial instruments available in the global market (bonds) if the gearing is not good enough and part of the equity in the capital invested is far more than the liability (Hwang and Ng, 2013, p.272). The state law also influences the management of projects. Certain legal sanctions halt the project from proceeding with 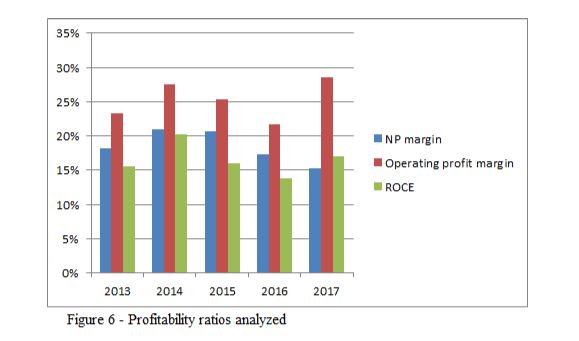 inflow, and such hindrances can lead to the project's failure.
Consideration of laws is imperative globally, as they vary across regions, and adherence to them from the project's inception ensures uninterrupted workflow, fostering project success. The ever-advancing technology landscape plays a pivotal role in commercial growth, offering a means to streamline projects and reduce overall costs. Implementing cutting-edge technology allows for efficiency gains, minimizing the need for extensive manpower and lowering project costs. A judicious choice of technology can lead to smoother operations with minimal chances of errors (Fleming and Koppelman, 2016).
In project dynamics, success hinges on the interplay of financial, commercial, and cost factors. Each of these factors carries positive and negative attributes, and their management by project leaders becomes pivotal in determining the project's fate.


Financial Statement Analysis
Financial statement analysis is a critical process that involves evaluating a company's financial statements to assess its financial performance and position. Key financial statements, including the Income Statement, Balance Sheet, and Cash Flow Statement, are scrutinized to glean insights into aspects like profitability, liquidity, solvency, and efficiency. Through various financial ratios and metrics, analysts can gauge a company's ability to generate profits, manage its debts, and utilize its assets efficiently. This analysis provides valuable information for investors, creditors, and management, aiding in informed decision-making and strategic planning.
Abstract
The report analyses and critically evaluates Intel’s and Cisco’s financial results. Where it is found that Intel is experiencing degrading performance as compared to the rival companies; however, it is still worth investing and the share price is witnessing a positive trend. Moreover, Cisco’s results are also not very much appreciated. All of these details and mentioned and explained below in detail.
Summary of the Basic Company Information
In 1968, discontented engineers Robert Noyce and Gordon Moore departed Fairchild Semiconductor Company to establish their venture, leveraging the wave of start-ups emerging at the time. Noyce articulated their vision in a one-page document, securing the support of venture capitalist Art Rock, who quickly raised 2.5 million dollars in under two days through convertible debentures (Cisco, 2017). Art Rock assumed the role of Intel's inaugural chairman (Intc.com, 2017).
In the semiconductor industry, Intel stands as a leader in terms of industry membership, main business focus, and principal location. Notably, it surpasses competitors such as Samsung, SK Hynix, Qualcomm, Micron Technology, Texas Instruments, Toshiba, Broadcom, STMicroelectronics, and Infineon Technologies. However, in some perspectives, Samsung is positioned above Intel.
Main Business
Principal Location
The primary location refers to the U.S. office located in California.
Competitive Environment
In the fiercely competitive semiconductor industry, multiple contenders vie for market share, as outlined earlier. In recent times, Samsung has surpassed Intel as the foremost microchip manufacturer, propelled by its expansion in mobile chip production. The sector undergoes constant evolution driven by innovative technologies and products introduced by manufacturers. The market landscape can swiftly transform in response to these technological advancements, as well as factors including shifts in customer and end-user demands, expectations, and preferences.
Brief Financial Information ─ a Five-Year Financial Review - Intel
2017 | 2016 | 2015 | 2014 | 2013 | |
|---|---|---|---|---|---|
$ in millions | |||||
Statement of Comprehensive Income |
| ||||
Sales | 62,761 | 59,387 | 55,355 | 55,870 | 52,708 |
Cost of Sales | 23,692 | 23,196 | 20,676 | 20,261 | 21,187 |
Gross Profit | 39,069 | 36,191 | 34,679 | 35,609 | 31,521 |
Expenses | 21,133 | 23,317 | 20,677 | 20,262 | 19,230 |
Operating Profit | 17,936 | 12,874 | 14,002 | 15,347 | 12,291 |
Finance Cost | 235 | 444 | 105 | 43 | 151 |
Tax | 10,751 | 2,620 | 2,792 | 4,097 | 2,991 |
Net Profit | 6,950 | 9,810 | 11,105 | 11,207 | 9,149 |
Statement of Financial Position | |||||
Fixed Assets | 93,749 | 77,819 | 62,699 | 64,226 | 60,274 |
Current Assets | 29,500 | 35,508 | 40,356 | 27,730 | 32,084 |
Total | 123,249 | 113,327 | 103,055 | 91,956 | 92,358 |
Current Liabilities | 17,421 | 20,302 | 15,667 | 16,019 | 13,568 |
Capital Employed | 105,828 | 93,025 | 87,388 | 75,937 | 78,790 |
Capital/Reserves | 69,885 | 67,108 | 61,982 | 56,777 | 58,256 |
Long-term Liabilities | 35,943 | 25,917 | 25,416 | 19,160 | 20,534 |
Equity and long-term loan | 105,828 | 93,025 | 87,398 | 75,937 | 78,790 |
Net increase(decrease) cash flow | (2,127) | (9,748) | 12,747 | (3,113) | (2,804) |
Ratios | |||||
Asset Turnover(times) | 0.51 | 0.52 | 0.54 | 0.61 | 0.57 |
Employees(number) | 107,600 | 106,000 | 107,300 | 106,700 | 107,600 |
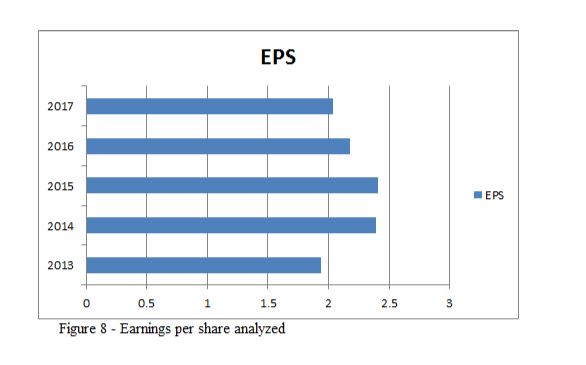
EPS(basic) | 2.04 | 2.18 | 2.41 | 2.39 | 1.94 |
Dividend per share | 1.08 | 1.04 | 0.96 | 0.9 | 0.9 |
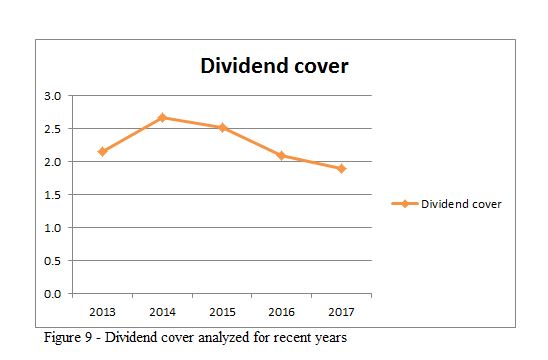
Dividend cover(times) | 0.73 | 0.50 | 0.41 | 0.39 | 0.49 |
Inventory Turnover(times) | 3.39 | 4.18 | 4.00 | 4.74 | 5.08 |
Gearing (debt: equity) | 0.34 | 0.28 | 0.29 | 0.25 | 0.26 |
Interest Cover(times) | 76.32 | 29.00 | 133.35 | 356.91 | 81.40 |
Table A: Five-year Financial Review | |||||
Get 3+ Free Dissertation Topics within 24 hours?
Evaluation of Financial Statements: A Comparative Analysis
The market capitalization of the companies in comparison (Intel and Cisco) is as follows:
Billion $ | Intel | Cisco |
Market Capitalization | 245 | 208 |
Table B – market capitalization | ||
Due to the comparability of the sizes of the two companies, we perform a financial analysis of the performance and standing of both companies with the help of ratios.
Liquidity
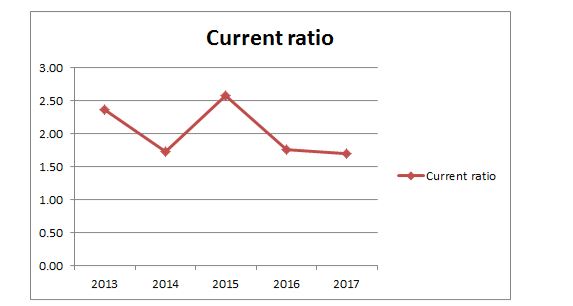
The liquidity trend of the company has been inconsistent, showing a decline from 2013 to 2017. This irregularity is attributed to Intel's current asset and liability fluctuations. Despite this, the current ratio remains consistently above 1 throughout the considered periods, indicating that the company is well-positioned to meet short-term obligations and pay creditors. This stability is evident in the current ratio graph (refer to Figure 1).
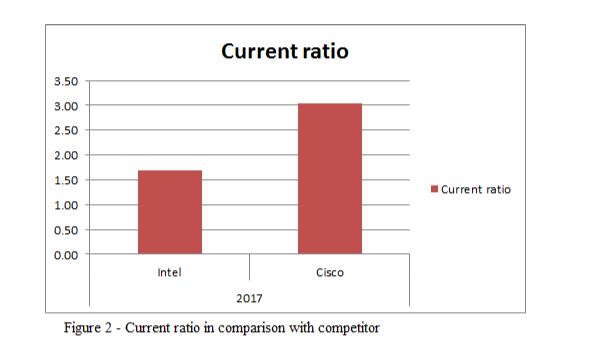
However, a comparative analysis with rival company Cisco reveals that Intel's current ratio is nearly half of Cisco's. This discrepancy is primarily attributed to Cisco's substantial investments, which are significantly larger than Intel's holdings (Financials.morningstar.com, 2017).
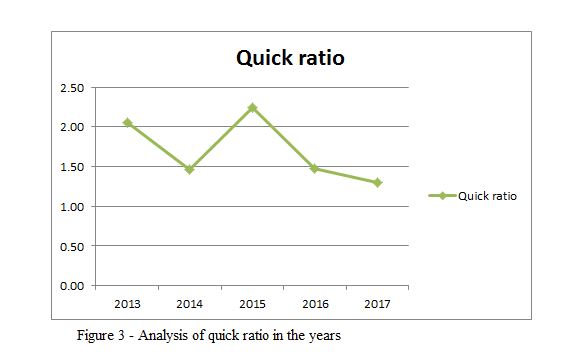
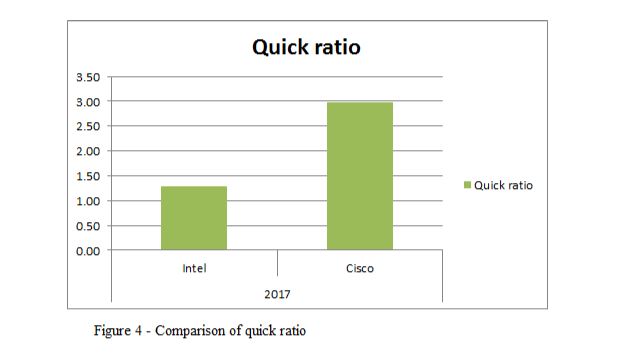
Moreover, examining Intel's acid test ratio in recent years mirrors the trends observed in the current ratio analysis. Please refer to Figures 3 and 4 in the appendix for a detailed visual representation.
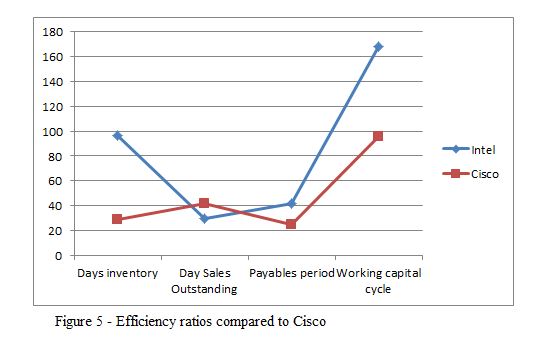
Efficiency
Efficiency is paramount for organizational success, signifying optimal resource utilization to achieve maximum output. It involves streamlined processes, cost reduction, and enhanced productivity, fostering competitiveness and effectiveness.
Efficiency ratios | 2013 | 2014 | 2015 | 2016 | 2017 |
Days inventory | 76.71 | 76.07 | 83.32 | 84.34 | 96.57 |
Day Sales Outstanding | 25.67 | 26.16 | 30.38 | 29.12 | 29.94 |
Payables period | 51.61 | 51.5 | 42.47 | 35.7 | 41.62 |
Working capital cycle | 153.99 | 153.73 | 156.17 | 149.16 | 168.13 |
Table C - Efficiency ratios in comparison | |||||
Efficiency ratios reveal a consistent upward trend, except for a decline in the payables period 2016. Concerningly, the inventory period has increased over the years, indicating a prolonged time to convert inventory into cash. A similar trend is observed in the receivables period, signalling delayed debt settlements, which is an unfavourable scenario (Financials.morningstar.com, 2017).
Conversely, the decreasing payables period, suggesting a quicker settlement with creditors is commercially unhealthy. The overall working capital cycle is expanding, indicating a prolonged time to convert invested capital back into cash, attributed to unfavourable credit terms and funds tied up in stock.
Comparing efficiency ratios with Cisco for 2017, Intel exhibits a lower debtor collection period, while all other ratios are higher than Cisco, as illustrated in Figure 5.
Profitability
Profitability ratios reveal an inconsistent trend, with an overall decline in the net profit margin, as depicted in Figure 6. Unlike Cisco, Intel's net and operating profit margins are lower, primarily due to a significant revenue difference between the two companies. However, Intel surpasses Cisco regarding the return on capital employed, showcasing a higher efficiency in capital utilization (Financials.morningstar.com, 2017).
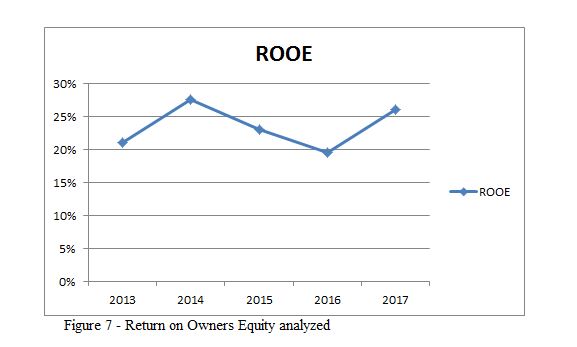
Investor Ratios
An erratic yet overall positive trend is observed upon comparing the owners' equity ratio, as illustrated in Figure 7. Similarly, in the case of earnings per share, the trend remains positive, as depicted in Figure 8. The dividend yield exhibited an upward trajectory over recent years, whereas the dividend cover shows a declining trend.
Solvency Ratio
The solvency ratios calculated for Intel are also on a downward trend. See the table below for details:
2013 | 2014 | 2015 | 2016 | 2017 | |
Solvency ratios | 0.28 | 0.32 | 0.27 | 0.22 | 0.18 |
Horizontal Analysis-Cisco
Statement of Comprehensive Income | 2017 | 2016 | Difference | % |
Sales | 62,761 | 59,387 | 3,374 | 6% |
Cost of Sales | 23,692 | 23,196 | 496 | 2% |
Gross Profit | 39,069 | 36,191 | 2,878 | 8% |
Expenses | 21,133 | 23,317 | (2,184) | -9% |
Operating Profit | 17,936 | 12,874 | 5,062 | 39% |
Finance Cost | 235 | 444 | (209) | -47% |
Tax | 10,751 | 2,620 | 8,131 | 310% |
Net Profit | 6,950 | 9,810 | (2,860) | -29% |
Statement of Financial Position | ||||
Fixed Assets | 93,749 | 77,819 | 15,930 | 20% |
Current Assets | 29,500 | 35,508 | (6,008) | -17% |
Total | 123,249 | 113,327 | 9,922 | 9% |
Current Liabilities | 17,421 | 20,302 | (2,881) | -14% |
Capital Employed | 105,828 | 93,025 | 12,803 | 14% |
Capital / Reserves | 69,885 | 67,108 | 2,777 | 4% |
Long term Liabilities | 35,943 | 25,917 | 10,026 | 39% |
Equity and long-term loan | 105,828 | 93,025 | 12,803 | 14% |
Table E - Horizontal Analysis |
Vertical Analysis-Cisco
Statement of Comprehensive Income | 2017 | 2017 | 2016 | 2016 |
|---|---|---|---|---|
| Amount | %age | Amount | %age |
Sales | 62,761 | 100% | 59,387 | 100% |
Cost of Sales | 23,692 | 38% | 23,196 | 39% |
Gross Profit | 39,069 | 62% | 36,191 | 61% |
Expenses | 21,133 | 34% | 23,317 | 39% |
Operating Profit | 17,936 | 29% | 12,874 | 22% |
Finance Cost | 235 | 0% | 444 | 1% |
Tax | 10,751 | 17% | 2,620 | 4% |
Net Profit | 6,950 | 11% | 9,810 | 17% |
Statement of Financial Position | Amount | %age | Amount | %age |
Fixed Assets | 93,749 | 89% | 77,819 | 84% |
Current Assets | 29,500 | 28% | 35,508 | 38% |
Total | 123,249 | 116% | 113,327 | 122% |
Current Liabilities | 17,421 | 16% | 20,302 | 22% |
Capital Employed | 105,828 | 100% | 93,025 | 100% |
Capital / Reserves | 69,885 | 66% | 67,108 | 72% |
Long term Liabilities | 35,943 | 34% | 25,917 | 28% |
Equity and long-term loan | 105,828 | 100% | 93,025 | 100% |
Table F - Vertical Analysis |
|
|
|
|
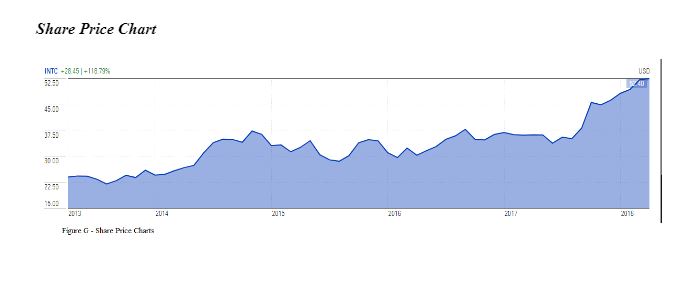
Share Price Chart
The share price chart is showing a positive trend
Conclusion
Intel's overall performance has significantly declined, primarily due to heightened competition from Samsung and AMD, among other suppliers. In contrast to Cisco, Intel exhibits less liquidity, efficiency, and profitability. However, Intel's investor ratios show potential for investment in the public domain. While Cisco outperforms in liquidity ratios, Intel boasts a superior solvency ratio, indicating better overall solvency than Cisco, primarily due to Intel carrying fewer liabilities.
It's important to acknowledge limitations in ratio analysis. Historical information from financial statements can only be compared within the available data, and inflation rates are not factored into the figures, introducing a limitation. Additionally, while comparable, Cisco is not solely a microprocessor company, and variations in accounting policies and strategies between Intel and Cisco may impact the accuracy of the comparison. Finally, companies may pursue different strategies, rendering some comparisons potentially meaningless.
References
Cisco, A. (2017). Annual Reports. [online] Cisco. Available at: https://www.cisco.com/c/en/us/about/annual-reports.html [Accessed 19 Apr. 2018].
Financials.morningstar.com. (2017). Growth, Profitability, and Financial Ratios for Intel Corp (INTC) from Morningstar.com. [online] Available at: http://financials.morningstar.com/ratios/r.html?t=INTC [Accessed 19 Apr. 2018].
Financials.morningstar.com. (2017). Growth, Profitability, and Financial Ratios for Cisco Systems Inc (CSCO) from Morningstar.com. [online] Available at: http://financials.morningstar.com/ratios/r.html?t=CSCO [Accessed 19 Apr. 2018].
Fleming, Q.W. and Koppelman, J.M., 2016, December. Earned value project management. Project Management Institute.
Harrison, F., and Lock, D., 2017. Advanced project management: a structured approach. Routledge.
Hwang, B.G. and Ng, W.J., 2013. Project management knowledge and skills for green construction: Overcoming challenges. International Journal of Project Management, 31(2), pp.272-284.
Intc.com. (2017). Intel Corporation - Investor Relations - Financials & Filings - Annual Reports & Proxy. [online] Available at: https://www.intc.com/investor-relations/financials-and-filings/annual-reports-and-proxy/default.aspx [Accessed 19 Apr. 2018].
Kerzner, H. and Kerzner, H.R., 2017. Project management: a systems approach to planning, scheduling, and controlling. John Wiley & Sons.
Larson, E.W. and Gray, C., 2013. Project management: The managerial process with MS project. McGraw-Hill.
Nixon, P., Harrington, M. and Parker, D., 2012. Leadership performance is significant to project success or failure: a critical analysis. International Journal of Productivity and Performance Management, 61(2), pp.204-216.
Schwalbe, K., 2015. Information technology project management. Cengage Learning.
Appendices
Appendices serve as a treasure trove of supplementary information, giving readers a deeper understanding of the main document's content. These additional materials may include charts, graphs, detailed data sets, or any extra information that enhances the overall comprehension of the subject matter. Think of them as the backstage pass to a comprehensive exploration of the topic, offering valuable insights that enrich the reader's experience and bolster the credibility of the main document.
Appendix A