Design of Two-Layer Spiral Filters Using Electromagnetic CAD Tools (SONNET Software)
January 27, 2021
Entrepreneurial skills
January 28, 2021
Deep-rooted in engineering ingenuity, anchor retaining walls stand as stalwart guardians, embracing the weight of many floors with a steadfast grip on both soil and architectural fortitude.
Outline
- Introduction
- Basic Principles of Anchored System Design
- Selection of Soil Parameters for Design
- Design of Anchored Systems
- Design Analysis
- Results
- Discussions
- Conclusion
- References
In the vast landscape of civil engineering, retaining walls stand as fundamental elements, steadfast guardians against the challenges of sloping terrains. Their multifaceted roles extend beyond mere barriers; they are artisans sculpting landscapes, stabilizing slopes, and thwarting soil erosion to ingeniously craft usable spaces. Their significance becomes even more pronounced when confronted with the complex task of erecting multi-story buildings on undulating terrains. In this intricate dance between nature's contours and architectural aspirations, the deep anchor retaining wall emerges as the unsung hero, silently but robustly supporting the narrative of structural engineering.
Discover the engineering intricacies of deep anchor retaining walls for multiple floors.
The ensuing exploration of deep anchor retaining walls is a journey into the intricacies of structural finesse. Purposefully designed for multi-story constructions on challenging landscapes, these walls embody a fusion of functionality and aesthetics. Beyond the conventional roles of stability and support, these structural marvels serve as canvases for architectural expression. Anchors and tiebacks, strategically positioned beneath the surface play pivotal roles in countering lateral forces, creating a synergy that transforms a retaining wall into an integral part of the aesthetic tapestry. In the upcoming discussion, we will unravel the layers of their design, shedding light on how these walls anchor structures and contribute profoundly to the visual harmony of the built environment.


Introduction
In highway construction endeavours, anchor retaining walls are crucial for stabilizing slopes and excavations. These walls, equipped with various levels of ground anchors, include non-gravity cantilever structures meticulously designed to meet the specific demands of each project.
The design of anchor retaining walls often involves integrating continuous or discrete vertical elements. These elements, drilled to depths below the finished excavation grades, derive support from their inherent bending and shear stiffness and the resistances offered by the underlying soils. Ground anchors, crucial components in these structures, are pivotal in providing lateral resistance against horizontal pressures exerted by external forces such as earth, water, and seismic activity.
The vertical elements, commonly comprised of drilled shafts or steel piles, are strategically spaced to form the skeletal framework of anchor retaining walls. Structural-facing techniques are then employed to span and connect these discrete elements, ensuring stability and cohesion in the overall design. In highway projects involving the construction of depressed roadways, roadway alignments, and road widening, anchor retaining walls prove indispensable for achieving grade separation.
Their economic advantage sets anchor retaining walls apart from traditional concrete gravity walls. The absence of excavation support, deep foundation support, and careful backfill selection make anchored walls a cost-effective solution. Additionally, these versatile structures find application in bridge construction, serving as abutments for new bridges or facilitating the removal of abutments from existing bridges (FHWA-RD-97-130, 1998). Essentially, anchor retaining walls emerge as stabilizing agents in highway projects and efficient and economical alternatives to conventional retaining wall solutions.
Basic Principles of Anchored System Design
The design of anchored systems encompasses fundamental principles crucial for ensuring stability and structural integrity. Anchored systems, whether applied in retaining walls, foundations, or other structures, rely on a meticulous understanding of the forces at play. Key considerations include anchors' proper placement and orientation, which provide essential lateral support against external pressures such as soil loads or water. The selection of appropriate materials, accounting for factors like soil properties and load distribution, is paramount. Additionally, the design must address factors such as anchor spacing, embedment depth, and load distribution to optimize the system's overall performance. These basic principles form the cornerstone of anchored system design, ensuring that structures resist external forces effectively and maintain durability and longevity.
General Design Concepts for Anchor Retaining Walls
The system of anchor retaining walls is dedicated to establishing a stable internal mass of soil capable of resisting various structural failures within defined serviceability parameters. The anchor retaining wall design necessitates carefully considering potential failures and conditions to ensure economic feasibility and practical constructability (Abramson, 1993). During the design process, it is crucial to account for the resistance offered by wall elements and anchors, aligning them to effectively counteract the applied loads on the wall system, including those from external forces, water, and soils.
To achieve equilibrium, the total force exerted by the anchored walls must be carefully balanced, with the anchors providing stabilized forces transmitted into the soils at an optimal distance (illustrated in Figure a). Determining the minimum distance behind the wall involves considering the transmission of anchor forces behind the active zone and defining the bond length of the anchor. This bond length should extend to intersect with potential surfaces of failure passing through the anchors and beneath the wall base, as depicted in Figure B. The depth of anchor installation is determined by identifying the location of the deepest surfaces prone to failure, areas often lacking sufficient safety factors without the contribution of anchor forces.
For effective support, the soil adjacent to the equilibrium excavation should be buttressed by the anchored walls, dictating the maximum force requirements for anchors and the maximum bending moments, strengths, and dimensions within the wall section. Extending the anchors into the soil ensures sufficient safety for deep-seated and shallow potential failure surfaces. The anchor forces act on potential slip surfaces, guaranteeing more acceptable safety factors (American, 1994).
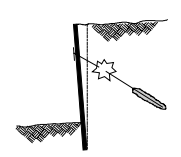
Figure 1: tensile failure of the tendon
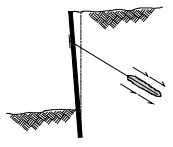
Figure 2: pullout failure of grout
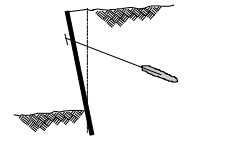
Figure 3: Pullout failure of the tendon
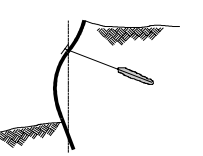
Figure 4: Failure of the wall in bending
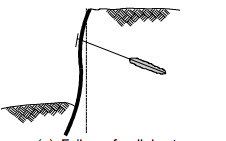
Figure 5: Failure of the wall due to insufficient passive capacity
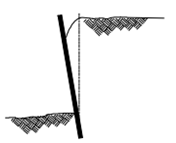
Figure 6: Failure by forwarding rotation (cantilever before the first anchor installed)
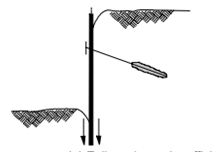
Figure 7: Failure due to insufficient
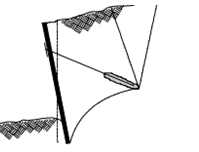
Figure 8: Failure by overturning
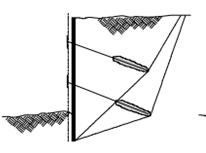
Figure 9: Failure by sliding
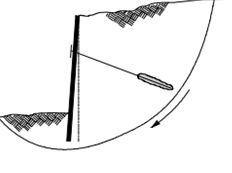
Figure 10: Rotational failure of groundmass
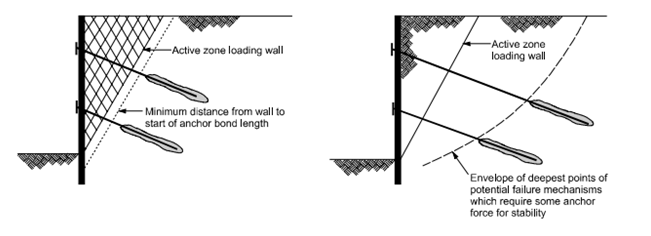
Figure 11: Contribution of ground anchors to wall stability.
Selection of Soil Parameters for Design
The selection of soils for efficient anchor retaining wall design is contingent upon their shear strength forces, with a thoughtful consideration of their ability to withstand lateral pressures. This approach ensures the foundation aligns seamlessly with the structural requirements, emphasizing the significance of evaluating shear strength characteristics for optimal stability against external forces, water influences, and potential soil movements. It underscores the fundamental role of selecting soils that match the necessary shear strength forces, forming a crucial aspect of anchor retaining walls' reliable and effective design.
Drained Shear Strength of Granular Soils
Granular soils are characterized by their drained shear strengths and the resulting stress friction angles, with challenges arising in sampling due to the nature of these soils. Obtaining accurate deposits in such cases proves difficult. However, precise estimation procedures can leverage the friction angle for effective utilization when designing a wall.
Undrained Shear Strength of Normally Consolidated Clay
Consolidated clay exhibits instability in undrained conditions, particularly under contractive shear conditions, exemplified by deformation mechanisms mobilizing resistances through frictional shearing. This propensity for contraction under confining stresses is a characteristic feature of medium and soft clays, especially those lightly over-consolidated (Andersen, 1984). The permeability of clay soil, in terms of the rate of shearing, obscures the soil's contracting ability for researchers. Positive pore-water pressures generated under these conditions reduce the soil's effective stress and frictional shear resistance. Consequently, shearing resistance within the soil is diminished compared to drained conditions, characterized by soil volume contraction. The short-term drainage condition is critical for anchored walls constructed in clay soils with normal to light consolidation.
Undrained Shear Strength of Overconsolidated Clay
When clay soil undergoes unloading conditions resulting from excavation for anchored wall construction, it expands due to frictional shearing resistance. This expansion induces negative pore-water pressure, increasing the soil's mobilized frictional shearing resistance and effective stresses (Barley, 1997).
In the case of over-consolidated clay subjected to excavation, the strength and short-term stability may be exceeded after a single drainage event. Stiff to hard over-consolidated soils and clays are preferable for temporary and permanent anchored walls. Over-consolidated clay soils that have undergone significant operations are more prone to fissuring.
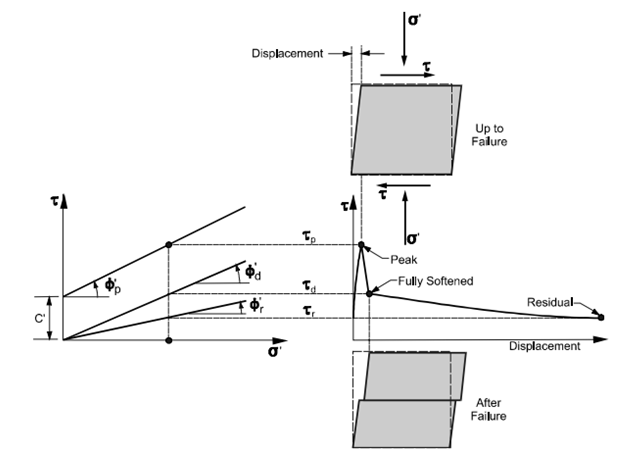
Figure 12: Simplified drained stress-displacement relationship for a stiff clay (modified after Construction Industry Research and Information Association (CIRIA), 1984).
In the case of over-consolidated clays exhibiting stiff and hard characteristics, designers of anchored systems must determine the appropriate strength for the design. In locations where surface failures in the clay are evident, designers should utilize residual strengths when developing anchored system designs. Anchored systems have the capability to stabilize active landslides.
Under these conditions, assuming a sufficiently large deformation to reduce the strength to a typical residual value is reasonable. Stark and Eid (1994) have presented a correlation that establishes the relationship between liquid limits, clay fraction size, and the angle of residual fraction for clay soils, aiding in determining design parameters for such scenarios.
Design of Anchored Systems
This chapter outlines a 13-step procedure to provide a comprehensive guide for designing anchored systems. The focus is on an anchored retaining wall applied within a specific support system, and the selection of the wall type is based on consultation with FHWA-SA-96-038 (FHWA, 1997).
The initial step involves establishing overall geometric requirements for the anchor retaining wall system and identifying project constraints and requirements. This step also includes the development of the wall profile and the location of wall appurtenances such as utilities, traffic barriers, and considerations for construction sequences and the cost of the wall systems.
Steps 2 to 13 delve into specific structural and geotechnical aspects of designing the anchor retaining wall. The design process follows a sequence outlined in FHWA-RD-81-150 (1982).
Step 1
Initiate the design process by establishing fundamental project requirements, encompassing external loading, geometry, construction constraints, and performance criteria.
Step 2
Evaluate relevant properties of rocks and soil, conducting a thorough assessment of subsurface conditions.
Step 3
Select appropriate levels of corrosion protection and establish design safety factors and properties.
Step 4
Determine earth pressures on the back of the wall to evaluate the final wall height. Assess total pressure after factoring in water and surcharging. If marginal soils are used, consider a staged analysis of construction.
Step 5
Calculate wall bending moments and loads of horizontal ground anchors. Adjust the locations of vertical anchors to achieve an even distribution of the wall bending moment.
Step 6
Evaluate the required anchor inclination, considering right-of-way limitations. Define the locations of underground structures and suitable anchoring strata.
Step 7
Resolve each load of the horizontal anchor into vertical components of force and the force applied along the length of the anchor.
Step 8
Determine the horizontal spacing of anchors based on different wall types. Calculate individual anchor loads.
Step 9
Select the appropriate type of ground anchor.
Step 10
Evaluate the lateral and vertical capacity of the wall below the sub-grade excavation. Revise the wall section if necessary.
Step 11
Assess the internal and external stability of the anchor wall. Revise the geometry of the ground anchor if needed.
Step 12
Estimate maximum wall movements and surface settlements of the ground.
Step 13
Design connection devices, wallers, drainage systems, and select lagging according to the specifications outlined by Bruce (1997).
Evaluation of Earth Pressures for Wall Design
The distribution of earth pressure on anchored walls is contingent upon the deformations of the lateral wall and their magnitude. Substantial deformations are anticipated in cantilever walls with significant flexibility under non-gravitational modes. These deformations are adequate to induce active earth pressure across the entire height of the wall. For the design of such systems, theoretical diagrams of active earth pressures, developed using Coulomb analysis or Rankine methods, can be employed.
Deformation patterns become more intricate for anchored wall systems constructed from a top-down approach. These systems do not align well with theoretical design calculations based on Coulomb's earth method or Rankine pressure distributions. The deformation patterns of the wall are directly influenced by anchor inclination, soil shear strength, vertical spacing of anchors, anchor lock-off loads, and wall stiffness (Bruen, 1996).
Staged analysis for construction is deemed necessary under certain circumstances, including:
- Nearby foundations exert influence on the wall.
- The wall is encountering significant surcharge loadings.
- The retained soil exhibits preexisting planes or instabilities.
The total required load for stabilizing an excavation or slope can be assessed using limit equilibrium calculations. Hand calculation methods involving limit equilibrium calculations, slope stability analysis through computer programs, and trial wedge techniques can be employed. Limit equilibrium calculations' validity aligns with earth pressure diagrams (CIRIA, 1980).
Terzaghi and Peck Apparent Earth Pressure Diagrams
The figure illustrates earth pressure diagrams, with the maximum pressure denoted as "p." The development of envelopes for Terzaghi and Peck takes into account the following factors:
Excavation Size and Depth: The excavation is assumed to be wide and exceeds a depth of 6 meters. Mobilizing the full value of soil shear strength is achievable by assuming larger wall movements.
Groundwater Position: Groundwater is assumed to be below the base level for sand excavation. However, in the case of clays, the position is deemed unimportant, and water pressure loading is not specifically considered (FHWA, 1986).
Soil Behavior and Mass: The soil is assumed to be homogeneous and drained during sand shearing. For clays, an undrained condition is assumed, particularly for short-term loadings.
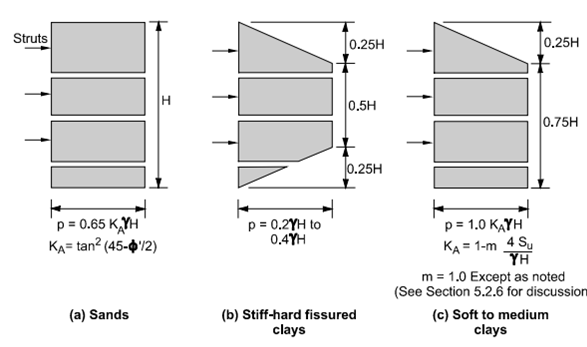
Figure 13: Terzaghi and Peck apparent pressure envelopes (after Terzaghi and Peck, 1967, Soil Mechanics in Engineering Practice, Reprinted by permission of John Wiley & Sons, Inc.).
The exposed portion of the wall will be subjected to the loading diagrams.
The stability numbers are related to the apparent earth pressures for clays and are defined below:
Where
γ = total unit weight of the clay soil,
Su = average undrained shear strength of the clay soil below the base of the excavation, a
H = excavation depth.
Standard SI units are:
γ= (kN/m3),
Su = (kPa),
H = (m).
As shown in the figure, two apparent envelopes of the earth pressure can be developed with high and low Ns values. The envelopes showed the results for the stiff to hard and soft to medium clays. Recommendations for the anchor retaining wall systems are derived by using these diagrams as references.
For sand, the value of Ka can be evaluated, as shown in Figure A.
The maximum ordinate of the earth's pressure is found to be
Where
φ′ =the effective stress friction angle of the sand.
The lateral earth's total load has been calculated using the value of lateral earth pressure from the rectangular apparent earth pressure diagram, as shown in Figure A for sands. The value is found to be
0.65 KaγH2
The apparent earth pressure envelope for the single-level anchored walls or the anchored walls with greater levels of ground anchors has been recommended to be trapezoidal, as shown in the figure.
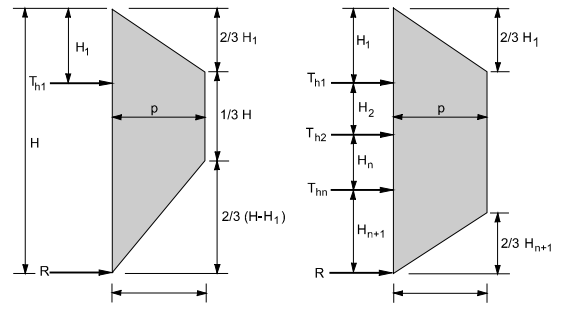
Figure 14: walls with one level and multi-levels of anchor retaining walls
H1 = distance from the ground surface to the uppermost ground anchor
Hn+1 = distance from the excavation base to the lowermost ground anchor
Th1 = horizontal load in-ground anchors
R = reaction force is to be resisted by subgrade
P = maximum ordinate of the diagram
The trapezoidal diagram recommends the location of the lower and upper ends of the ground anchors, which are required to construct the apparent diagrams of the earth's pressures. There are many reasons which prove the appropriateness of the trapezoidal diagrams more than the rectangular ones.
- The earth's pressures concentrate on the anchor locations resulting from the arching.
- At the ground surface, the earth pressure is zero and found to be more appropriate for sands when no surcharge loading is present.
- Moving from the ground surface to the upper location of the ground anchor, the earth pressures are increased.
The diagram for sands is appropriate for short-term and long-term loadings. The total lateral load acting on the wall is then calculated by explicitly adding the surcharge and water pressures to the earth pressure diagram (Golder et al. 1970).


Recommended Apparent Earth Pressure Diagram for Stiff to Hard Fissured Clays
The recommended apparent earth pressure diagram for stiff to hard fissured clays provides a succinct guide for understanding earth pressure distribution along anchored walls. Tailored to the specific characteristics of these clays, the diagram considers factors like soil shear strength, anchor inclination, and wall stiffness, offering valuable insights for designing stable and reliable anchored structures in challenging geological conditions.
Temporary Conditions
In this study, apparent earth pressure diagrams tailored to stiff to hard fissure clays have been employed. The design of anchor retaining walls draws upon previous successful experiences with excavation constructions in similar soil conditions. The extent of fissuring in the clay is directly impacted by the earth's pressures within the soil, as highlighted in previous research by Hanna (1982).
Observations
One of the most important observations is that the system must resist as much load as twice designed using an envelope based on the upper range value of the maximum ordinate pressure.
6‑1 summary of trapezoidal apparent pressure envelopes for stiff to hard clays
Reference | b1 | b2 | b3 | Range of maximum pressure ordinate, p | Total load |
Terzaghi and Peck (1967) | 0.25 | 0.50 | 0.25 | 0.2γH - 0.4γH | 0.15γH2- 0.30γH2 |
Schnabel (1982) | 0.20 | 0.60 | 0.20 | 0.2γH (1) | 0.16γH2 |
Winter (1990) | 0.20 | 0.60 | 0.20 | 0.2γH - 0.32γH(1) | 0.16γH2 - 0.26γH2 |
Ulrich (1989) | 0.25 | 0.50 | 0.25 | 0.2γH - 0.4γH | 0.15γH2 - 0.30γH2 |
FHWA-RD-75-130 (1976) | 0 | 1.0 | 0 | 0.15γH - 0.30γH | 0.15γH2 - 0.30γH2 |
This work | 0.17 | 0.66 | 0.17(4) | 0.2γH - 0.4γH | 0.17γH2 - 0.33γH2 |
For the earth pressure diagrams of the Terzaghi and Peck for the temporary loadings, the maximum pressure p has been found to range from 0.2γH - 0.4γH, as illustrated in Figure B. The total load is thus ranging from 0.15γH2-0.30γH2. The weight of the stiff to hard clay was assumed to be 20 kN/m3. This diagram has estimated the total load, about 3H2 - 6H2.
H was measured in meters, and the total load was measured in kN/m. The measurement of the ground anchor load was presented by Ulrich (1989) for seven excavation walls. Each excavation showed that the stability number Ns is less than 4.
Figure 25 shows the measured loads. The maximum ordinate for the earth pressure ranges from 0.1γH- 0.25γH approximately. The ordinates of these maximum pressures illustrate the total load used by the Terzaghi and Peck diagram by 1.5H2-3.75H2. The apparent earth pressure was found, and the value was 0.25γH- 0.35γH.
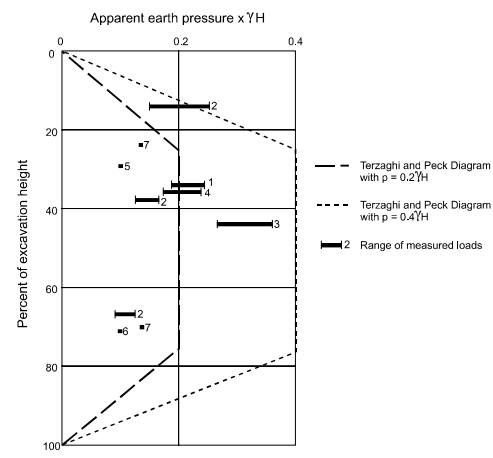
Figure 15: Measured anchor loads for seven projects (after Ulrich, 1989, “Tieback Supported Cuts in Overconsolidated Soils”, Journal of Geotechnical Engineering, Vol. 115, No. 4, Reprinted by permission of ASCE).
The recorded loads and the design pressure envelopes are illustrated in Figure 16 in terms of the percentage of the design values. The maximum pressure ordinate of the design pressure envelope has been observed to be equal to 30H psf, where H has been measured in feet.
For two test sections, the actual pressure envelopes equal 19H psf and 22H psf, about 65 to 75% of the actual design values. The total load for the design pressure of the 30H is equal to the 24H2 lb/ft. For the actual pressure envelops of 19H and 22H, the total load will be 15.2H2-17.6H2 lb/ft, respectively.
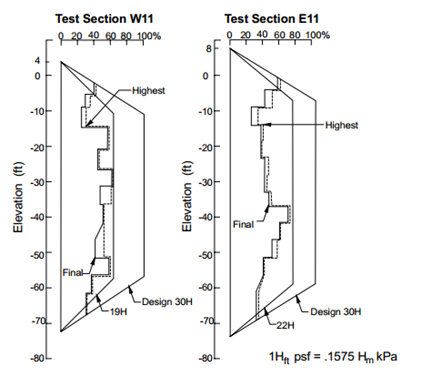
Figure 16: Wall pressure envelopes (after Winter, 1990, “Pacific First Center-Performance of the Tieback Shoring Wall”, Design and Performance of Earth Retaining Structures, Geotechnical Special Publication No. 25, Reprinted by permission of ASCE).
The results have illustrated that from the apparent envelops of the earth pressure; the lower bound values can be represented for the Terzaghi and Peck envelopes by the maximum values of the pressure ordinate. The maximum ordinate pressure has to be consistent with the value of the total load illustrated in the diagram, which is approximately 3H2-6H2.
For stiff and hard clays, the apparent diagrams of the earth pressure for the controlled short durations in the absence of the free water. For long-term or permanent conditions, these diagrams can be used for the evaluation of the drained strength parameters of the soil. The permanent conditions for stiff to hard clays are described in the following section (Institution 1997).
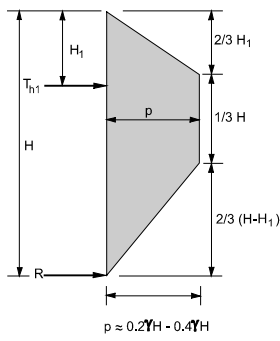
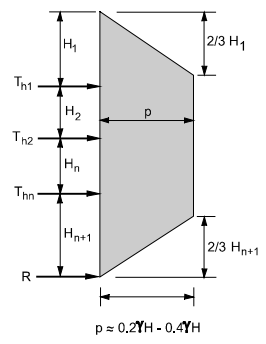
Figure 17: walls with multiple levels of ground anchors. Figure 18: walls with one level of ground anchors
H1 = distance from the ground surface to the uppermost ground anchor
Hn+1 = distance from the excavation base to the lowermost ground anchor
Th1 = horizontal load in-ground anchors
R = reaction force is to be resisted by subgrade
P = maximum ordinate of the diagram
Permanent Condition
The earth pressure diagrams were developed using the original Terzaghi and Peck for temporary loading conditions for stiff to hard fissured clays. For designing permanent walls, the earth pressure diagrams associated with temporary conditions are difficult to use (Littlejohn, 1992; Ludwig and Weatherby, 1989).
The diagrams of temporary conditions were used to calculate the total resultant force. The values are then compared to results obtained in the recommended earth pressure envelopes using the total resultant force of about 0.65KAγH2. The drained friction angle of the clay soil is found to be dependent upon the value of KA.
The drained friction angle in most anchored wall applications corresponds to the fully softened friction angle. The largest value of the resultant force was used from the given diagrams. A drained friction angle of about 39° resulted in an equivalent total force after using the maximum pressure ordinate of about 0.2γH.
Recommended Apparent Earth Pressure Diagram for Soft to Medium Clays
Soft to medium clays can be taken to construct the temporary and permanent anchor retaining walls. For the formation of the anchor bond zone, the competent layer must be within a reasonable depth below the level of excavation. Where the soft clays extend to the base of the excavation, permanently anchored walls are not recommended. For the deeper excavations and soft to medium clays, the Terzaghi and Peck diagrams have been used, as shown in Figure 23c. The coefficient of the total stress earth pressure can be illustrated as follows:
Where
m = empirical factor accounts for potential base instability effects in deeper excavations for the soft clays.
m is usually estimated to be equal to 0.4 for the Ns values of more than 6, and the excavation is underlain through deep soft clay. In other situations, m is estimated at 1 (Peck, 1969). The soil failure development below the base of the excavation can’t be accounted for by the procedure used by Terzaghi and Peck (1967) diagrams. The equation of Henkel (1971) was used to calculate the value of KA and the maximum pressure ordinate for the case of soft to medium clay.
The coefficient of total stress earth pressure has been evaluated by using Henkel’s equation
where
d = depth of the failure surface below the cut,
Su = undrained shear strength of the soil
Sub = strength of the soil providing bearing resistance
Henkel has provided the following solution for the case of unloading at the surfaces of the ground
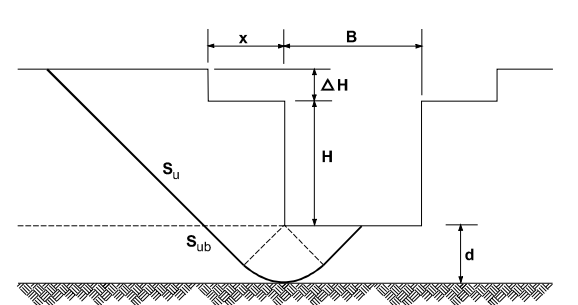
Figure 19: Henkel’s mechanism of base failure.
The KA values have been calculated using Henkel’s method at various ratios of d/H. figure 29 shows the results for Su = Sub. It has been illustrated in the figure that for 4<Ns<6, with the value of m=0.4 for the Terzaghi and Peck envelope, which is found to be more conservative concerning Henkel’s value. The validity of the Henkel equation is not applied for Ns<5.14, and the calculated earth pressure is found to be low unrealistically by using m=1.0.
The maximum pressure ordinate can be evaluated using the KA= 0.22 for the 4<Ns<5.14 range. Particularly for the transition states of soft to medium clay and stiff to hard clay or Ns=4. The total load is about 0.193γH2 for the KA= 0.22 using soft to medium clay. The stiff to hard fissured clay on the earth pressure diagram has a maximum pressure ordinate of about 0.26γH.
However, Henkel's method is limited to cases where the retained side clay soils can be characterized by constantly using the undrained shear strength value. The methods of limit equilibrium are preferred when profiles with more detailed shear strengths are required (Neelakantan and Richards, 1992).
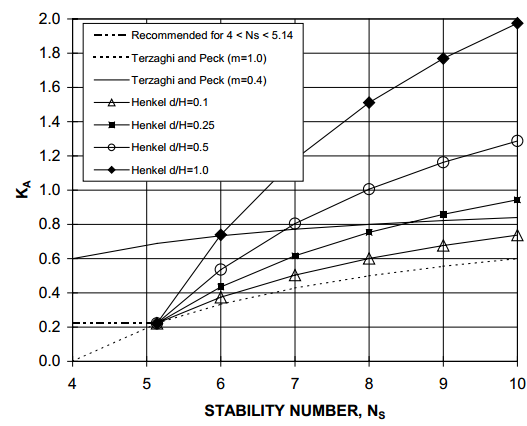
Figure 20: Value of KA based on Terzaghi and Peck envelope and Henkel’s method.
Design Analysis
Sliding Wedge Analysis Method
The total required horizontal load can be calculated using the sliding wedge analysis, an equilibrium method. For a wall of height H, a figure has been presented for free body and force vector illustrations. The soil used has been characterized by the front and behind the wall with the effective stress angle of friction φ’. The anchor bond zone is assumed for the failure surfaces to be passed in front of them, and full loads of anchors contribute to the wall's stability. The target factor of safety has been used to factor the shear strength, i.e.,
φ’mob=tan-1 (tanφ’/FS).
Over the embedment depth of the wall has been assumed for the passive resistance. The passive earth coefficient of pressure has been calculated using the interface friction angle δ that equals the φ’mob.
Analysis
The PREQ has represented the external horizontal force in the figure, and the stability has been provided in the vertical cut. The horizontal component of the anchor forces, i.e. T cos I and the embedded wall portion lateral resistance SPH, represent this force. The horizontal assumption of the PREQ suggests that the soldier beam has provided the vertical resistance SPV, which is found to be opposite in sign but equal in magnitude to loads of the ground anchors and their vertical components, T sin i.
The resisting force for PREQ can be calculated as follows.
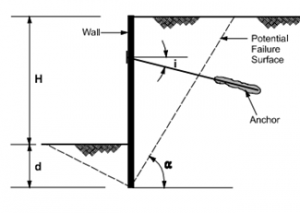
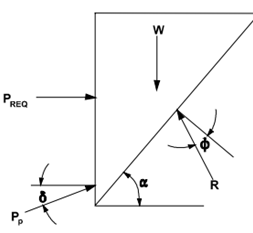
Figure 21: ground anchor wall system Figure 22: free body diagram
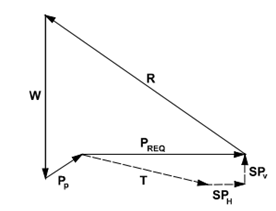
Figure 23: force vectors
Figures: Force equilibrium method for anchored walls (after FHWA-RD-98-065, 1998).
The iterative procedure has been adopted to find the solution, the angle of potential failure of the surface has been adjusted, and the depth of the wall embedment has been found. In the apparent pressure envelope, the load PREQ is then redistributed for the calculation of loads of the ground anchors and the moments of bending for the walls with their exposed portions.
Water Pressures
The large water loads must be resisted by designing the lagging and permanent anchor retaining walls. The retained soil at the drainage surface can be collected at the wall tops through ditches for systems of the walls. The prefabricated drainage elements have been used to collect the water from the subsurface. Such elements can be placed between the wall ending and top surfaces (Reese and Koop, 1974).
The associated water forces for the seepage residing beneath and behind the walls must be resisted, particularly for the temporary systems. For the homogenous soil, a flower has been illustrated for typical retaining walls in the figure. The calculations of pore-water pressure are simplified by making important assumptions, including the uniform dissipation of the head difference (H+i-j) through the flow path (2d+H-i-j), the shortest potential flow path.
Such paths are found to be run down through the back and front of the wall. The calculated pressure of the pre-water has increased pressures more than the hydrostatic pressures of the front walls. It is lesser than the hydrostatic pressures behind the wall, as illustrated in the figure.
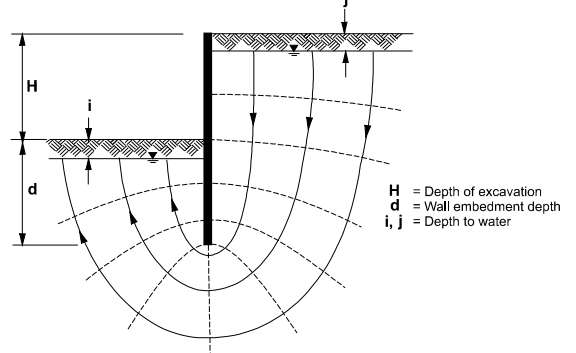
Figure 24: flow net for anchor retaining walls source (CIRIA 1984)
As shown in the figure, the bottom pressure of the wall is equal to the pressure on either side of the wall. Where the following equation gives the Uf value
The pressure acting on the wall has been shown in Figure b. the largest water pressure occurred at the water table level through the excavation and is given by:
The no-seepage condition of net water pressure has also been illustrated in the figure for efficient comparison.
Where the following equation has calculated the net pressure
Seepage flow nets have assessed the effects of the special drainage conditions on pore water pressures. The pore-water pressures vary greatly with the variations in the distances behind the wall and when the wall acts as a pure drain.
However, the procedure shown in the figure is insufficient for accurate calculations of the pressures behind the wall. Thus, for normal designing, simplified flowers can be used and assessed (Richards and Elms, 1992).
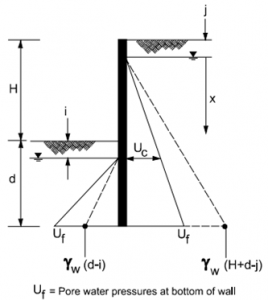
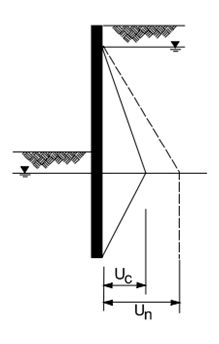
Figure 25: net water pressure. Figure 26: gross water pressure
Source: (CIRIA 1984)
Example
With the following characteristic parameters of the soil
A large lag of 1.5 m has been observed between the water table behind the wall and the water table in front. The force in each tie road must be measured using traditional methods for the anchored wall. The depth of embedment must also be measured using the limit state method.
Where
Force
The pressure distribution is shown in Figure 27; the net water pressure is estimated at point C.
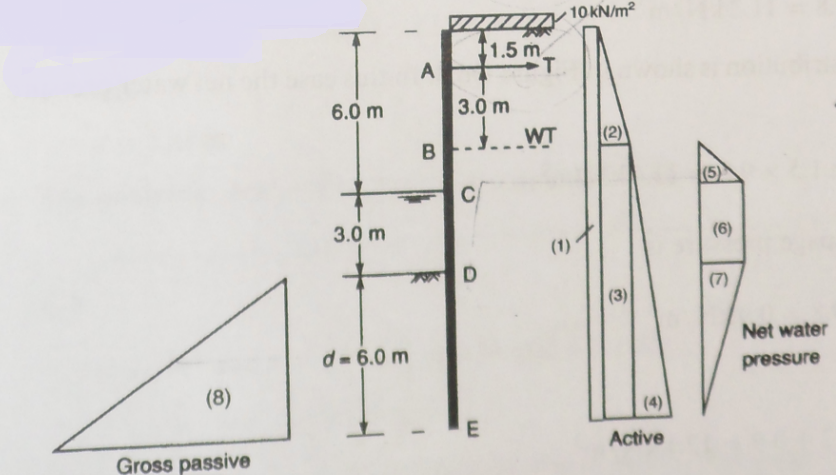
Figure 27: example wall
Average Seepage Pressure
Hence:
By considering the moments about the anchor point A in figure
Force (kN) | Arm (m) | Moment (kN.m) |
6.0 | 234.0 | |
1.5 | 71.1 | |
8.25 | 1832.0 | |
10.0 | 1734.0 | |
4.0 | 40.4 | |
6.0 | 241.2 | |
9.5 | 381.9 | |
4527 | ||
11.5 |
Available passive resistance
The Factor of Safety Force in Each Tie
Therefore
The surcharge is a variable action and thus applies a partial factor of about 1.30 to the force (1)
In this calculation, depth d has been estimated
Force (kN) | Arm (m) | Moment (kN.m) |
d/2+3 | ||
1.5 | 90.2 | |
d/2+5.25 | ||
2d/3+6.0 | ||
4.0 | 40.4 | |
6.0 | 241.2 | |
d/3+7.5 | ||
2d/3+7.5 |
Minimum Depth Embedment
By trial,
The minimum depth of embedment required is 5.44m
Results
The vertical loads applied at the ground surface are called surcharge loads and have been assumed to increase the lateral stresses uniformly throughout the wall height. For uniform surcharge loading, the increase in lateral stress can be evaluated by using the following equation (Romanoff, 1957)
Where:
∆σh = increase in lateral earth pressure due to the vertical surcharge load,
qs = vertical surcharge stress applied at the ground surface,
K =an appropriate earth pressure coefficient.
Standard SI units are:
∆σh (kPa), K (dimensionless), and qs (kPa)
Examples of the surcharge loads can be taken by including the system of highway walls.
- The resulting dead load surcharges can be evaluated by considering the approach of the bridge weight and concrete pavements.
- Due to the traffic loadings, the load surcharges include live load surcharges.
- During the construction of the anchored wall system, another surcharge was included due to the storage of material and equipment.
The anchor retaining wall has been expected to be designed for the pressure of the live load surcharge of the value of about 12 kPa when the traffic is assumed to be at the distance from the face of the wall that is equivalent to the ½ of the height of the given wall (AASHTO, 1996).
Compared to the surcharge loads, the line, strip, and point loads are the vertical loadings applied to the limited areas. The wall system design uses the lateral earth pressure increase, which is not found to be constant with varying depths, even in the case of uniform surcharge loadings.
The equations of elasticity theory for the distribution of the lateral stresses have been considered to calculate these loadings (NAVFAC, 1982). The design earth pressure envelopes are added with the lateral pressures resulting from the surcharges.
10‑2 Presumptive average ultimate bond stress for ground/grout interface along anchor bond zone (after PTI, 1996)
Rock | Cohesive Soil | Cohesionless Soil | |||
Rock type | Average ultimate bond stress (MPa) | Anchor type | Average ultimate bond stress (MPa) | Anchor type | Average ultimate bond stress (MPa) |
Granite and basalt | 1.7 - 3.1 | Gravity-grouted anchors (straight shaft) | 0.03 - 0.07 | Gravity-grouted anchors (straight shaft) | 0.07 - 0.14 |
Dolomitic limestone | 1.4 - 2.1 | Pressure- grouted anchors (straight shaft) | Pressure- grouted anchors (straight shaft) | ||
Soft limestone | 1.0 - 1.4 | • Soft, silty clay | 0.03 - 0.07 | • Fine-med. sand, med. dense – dense | 0.08 - 0.38 |
Slates and hard shales | 0.8 - 1.4 | Silty clay | 0.03 - 0.07 | Med.–coarse sand (w/gravel), med. dense | 0.11 - 0.66 |
Soft shales | 0.2 - 0.8 | Stiff clay, med. to high plasticity | 0.03 - 0.10 | Med.–coarse sand (w/gravel), dense - very dense | 0.25 - 0.97 |
Sandstones | 0.8 - 1.7 | Very stiff clay, med. to high plasticity | 0.07 - 0.17 | Silty sands Dense glacial till | 0.30 - 0.52 |
Weathered Sandstones | 0.7 - 0.8 | • Stiff clay, med. plasticity | 0.10 - 0.25 | Sandy gravel, med. dense-dense | 0.17 - 0.41 |
chalk | 0.2 - 1.1 | • Very stiff clay, med. plasticity | 0.14 - 0.35 | Sandy gravel, dense, very dense | 0.21 - 1.38 |
Weathered Marl | 0.15 - 0.25 | Very stiff sandy silt, med. plasticity | 0.28 - 0.38 | Med.–coarse sand (w/gravel), dense - very dense | 0.28 - 1.38 |
Concrete | 1.4 - 2.8 |
Discussions
As depicted in the figure, the horizontal anchor loads for multilevel and single-level anchor retaining walls can be calculated using tributary area calculations and the hinge method. In both approaches, it is assumed that there is a zero bending moment at the hinge developed for the excavation subgrade, where the subgrade functions as a strut. This assumption particularly applies to walls penetrating competent materials, as they offer more robust support. The design of the wall, influenced by the maximum bending moment, is typically evaluated for the exposed sections of the wall, particularly those above the subgrade of excavation. This methodology is grounded in prior research, referencing works by Romanoff (1972) and Sharma (1994).
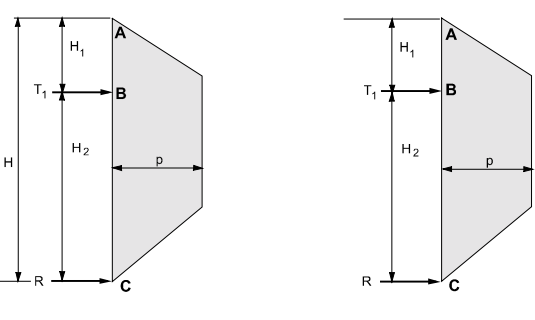
Figure 28: Tributary area method and hinge method
T1 = load over length H1+H2/2 T1 calculated from
R = load over length H2/2 R = total earth pressure - 1
Reaction factors have been introduced for those walls constructed into competent materials to support the soil's passive resistance below the excavation subgrade. To develop the passive resistance, the wall is required to be embedded significantly. The apparent pressure diagram area has been considered as a tributary area, which the lowest anchors carry. Considering the apparent pressure diagram, the reaction force is thus equivalent to the anchor load (Siller, 1992).
The data has been exhibited for the excavation base to the middle of the anchor or between the excavation base and the lowest end of the anchor. To penetrate the weak materials, the walls must have a sufficient passive capacity below the excavation base, which is not readily available for resisting the immediate reaction forces, which are independent of the depth of the wall embedment.
The lowest anchors have been designed for carrying the same loads as discussed above. The lowest anchor must also respond to the load in response to the reaction force. The foundation of the beam on elastic or the interaction of the soil and structure can be analyzed for the continuous design of the beams with small reaction toe (Siller and Frawley, 1992).
The values have been calculated by using the following figures. Where the anchor loads are taken as the horizontal component of the anchor/wall width Thi. The total load for horizontal anchor Th was then calculated as
The horizontal spacing between two anchors is denoted as s, and T is an anchor load used for designing the anchor bond zone.
The design load was then calculated as
Where
θ = angle of inclination of the anchor below the horizontal.
The total anchor load has been calculated using its total anchor load, denoted as Tv.
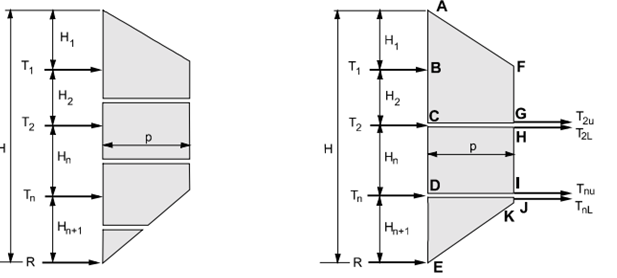
Figure 29: Tributary area method and hinge method
T1 = load over length H1+H2/2 T1 calculated from
T2 = load over length H2/2+Hn/2 T2u= total earth pressure (ABCGF)-T1
Tn = load over length Hn/2+Hn+1/2 T2L = calculated from
R = load over length Hn+1/2 Tnu = total earth pressure (CDIH)-T2L
TnL = calculated from
R = total earth pressure – T1- T2- Tn
T2 = T2u+T2L
Tn = Tnu+TnL
For strand tendons, the minimum length unbounded for the soil and rock is 4.5m; however, the value is 3m for bar tendons. A significant reduction in load can be prevented by such minimum values that have resulted from the losses of seating during load transfer to the structure that the testing of the anchor load has followed. The longer lengths, which are unbounded, are usually required to
- Minimum distance for the critical potential failure for the location of the bond length
- Anchoring in the appropriate ground for the location of the anchor bond zone
- To ensure the stability of the system of the anchored system completely
- For the accommodation of the long-term movements
In other words, behind the critical surface of the potential failure, the unbonded length can be extended to the minimum distance of about H/5 or 1.5 m. The extension has been made to accommodate the transfer of the minor loads to the grout column for the top bond zone of the anchored wall (Skempton, 1964).
The unbounded zone and the anchor bond zones have been grouted in one stage to maintain the hole's stability and to create the grout cover, which must be continuous against corrosion protection (Terzaghi, 1954). The large diameters of the anchors in which their unbounded length has been extended behind the critical surface of the potential failure offer significant strains at the top zones of the anchor bonds that have caused the load transfer throughout the grout column and above the bond zone of the anchor.
There are two stages in which anchors of larger diameters have been grouted. The anchor will be tested in the two-stage grouting system, and the bond length will be grouted under stage one. In stage two, the length portion of the drill hole, which is unbounded, was grouted, and then the anchor was tested for its performance. Due to the chances of local collapse, the procedure of two-stage grouting has not been recommended, which has to be accommodated by compromising the corrosion protection strategies of the grout.
Previous field experiences have been considered to estimate the load transfer capacity for the anchor bond lengths. Using the results of previous fields, the capacities have been estimated, and potential variations in the capacity have been accommodated.
The variations arise due to the differences in the grouting methods, installation procedures and corrosion protection techniques. in the soil deposits of given characteristics, the field capacity depends greatly on the different drilling methods, i.e. drill hole quality, cleaning procedures and the time the drill hole was kept open (Weatherby, 1998).
The pressures and the various methods used for grouting depend upon the diameter of the drill hole and the length of the bond zone of the anchor retaining wall. These items should be left at the discretion of the speciality anchor contractor, excluding certain minimum values. The minimum anchor capacity must be designed as the main responsibility of the designer to achieve the given ground type.
The capacity of these anchored wall tendons can be handled without the introduction of specialized or heavy equipment. One or two workers can be assigned to handle the stressing equipment without any aid of the lifting equipment mechanically (Whitman, 1990). The diameter of the drill is not more than 150mm except for the hollow stem anchors that have been approximated for 300 mm.
Few anchored walls are restricted to the length of 9 m to comply with the geometrical or geotechnical requirements. For bar tendons, the minimum length has been maintained up to 3 m; for the strand tendons, the length is about 4.5 m. The acceptable load reduction has been avoided by adopting these minimum unbounded lengths. These minimizations result from the losses due to the seating during load transformation and other pre-stress losses because of the creeping phenomena in the prestressing soil or steel (Wright, 1995).
The load transferred from the bond length to the soil has been estimated for the smaller values of the diameters, lesser densities and straight shaft anchors, which are gravity grouted particularly for the preliminary design parameters. In soil, the maximum allowable design load for anchor retaining walls are determined by multiplication of the ultimate transfer loads to the bond lengths and then dividing the product by a factor of safety 2.0
11‑3 Presumptive ultimate values of load transfer for preliminary design of small diameter straight shaft gravity-grouted ground anchors in soil.
Soil type | Relative density/Consistency (SPT range) (1) | Estimated ultimate transfer load (kN/m) |
Sand and Gravel | Loose (4-10) Medium dense (11-30) Dense (31-50) | 145 220 290 |
Sand | Loose (4-10) Medium dense (11-30) Dense (31-50) | 100 145 190 |
Sand and Silt | Loose (4-10) Medium dense (11-30) Dense (31-50) | 70 100 130 |
Silt-clay mixture with low plasticity or fine micaceous sand or silt mixtures | Stiff (10-20) Hard (21-40) | 30 60 |
Note: (1) SPT values are corrected for overburden pressure.
The anchor bond lengths typically range from 4.5-12 m for post-grouted soils, gravity-grouted and pressure-grouted soils. A significant increase in the capacity has been observed for the lengths of the bonds, which are about 12 m, by deploying the specialized methods for transferring loads from the top of the anchored retaining walls towards the bottom end. The anchor bond zones are taken as the function of surface tension; thus, the initial increments of the load transferred to the anchored walls have to be resisted through the soil present at the top of the anchor bond zone due to the presence of the strains of the upper grout body as illustrated in the figure.
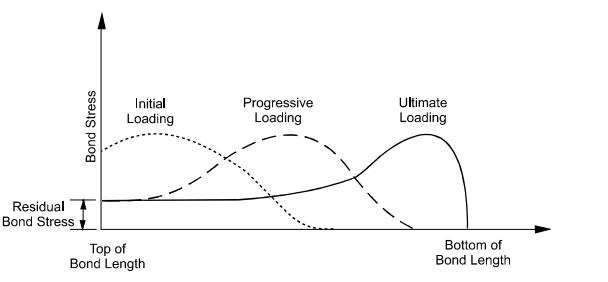
Figure 30: mobilization of the bond stress for anchors
The normal stresses applied onto the body of the grout have significantly increased the pressure groundings, particularly in cohesionless soils, which increase the confinement. The effective diameter has also been observed significantly for its small increase, specifically for the anchor bond zone. However, the capacity estimates are based on the hole diameters as-drilled.
The gravity-grouted bond stress values that have been estimated are illustrated in the table, which shows data for the pressure-grouted soil anchors as well. The variations in the ultimate values are thus quite obvious from these values. Reviewing the ultimate bond stress values, it is important to consider that the values are not necessarily required to be implied correspondingly for a larger capacity of anchors per unit length.
The hollow stem anchors, for example, can be considered for their greater capacity per unit length than those of their smaller diameters. The bond stress values are not argued for the anchor diameter but for the post-grouted anchor. The capacity of the cohesive soils can be increased by increasing the pressure grouting. On the other hand, in cohesive soils, the capacity can be increased by deploying the post-grouting phenomenon (Xanthakos, 1991).
The redial stresses act upon the body of the grout, which the post-grouting can increase and thus develop an irregular surface around the length of the bond that can lock the ground and the grout. In the post-grouted anchors, the load capacity is difficult to predict, resulting in the complexity of the procedures of the anchor grouting. However, the load capacity can be increased by post-grouting the ground anchors. The load capacity can be increased up to 20-50 per cent per phase with the common limit of three phases for the post-grouting.
A bond length of about 3-10m has been evaluated for the rock anchors while maintaining the minimum bond length of about 3m. The load transfer has been observed from the bond length to the sound rock competitively, which can be estimated through the various types of rocks.
A geologist may input a lower value, especially when the strength of the rock mass has to be controlled by the discontinuities in the structure. Incompetent rock, the maximum design load of the anchor can be determined by multiplying the ultimate transfer loads by the bond lengths and then dividing the whole term by the safety factor of 3.0.
The safety factor is higher than soil because it accounts for the uncertainties associated with the rock mass and its potential discontinuities, including fractures, joints and clay-filled fissures. The clay shales are an example of a weak rock; the transfer of bond stress is relatively uniform when compared with the value transferred in more competent rocks. Intermediate geometry is a common term for these weak rocks, which have unconfined compressive strength varying from 0.5-5.0 MPa. The anchor bond lengths of these materials can be evaluated by defining the design values and the safety factors of about 2.0 for the transfer values of ultimate loads.
11‑4 Presumptive ultimate values of load transfer for preliminary design of ground anchors in the rock
Rock type | Estimated ultimate transfer load (kN/m) |
Granite or Basalt | 730 |
Dolomitic Limestone | 580 |
Soft Limestone | 440 |
Sandstone | 440 |
Slates and Hard Shales | 360 |
Soft Shales | 150 |
For the interface of rock and grout, the measured ultimate bond stress ranges are illustrated in Table 7. It has been suggested by PTI (1996) that the rock and grout interfaces can be approximated for their ultimate bond stresses up to 10% of the rock’s compressive strength, which is unconfined and up to the maximum ultimate bond stress value of 3.1 MPa.
An implicit assumption has been made for calculating the bond length, which states the uniform mobilization of the bond at the interface of the rock and grout. The case is unlikely to occur unless the bond zone is expected to be formed in the weak or soft rock.
In the case of the competent rock, where the ratio of the elastic modulus of the grout and the rock is lesser than 1, the load is found to be transferred in the upper 1.5-3m of the bond zone of the anchor from the tendon to the rock. An additional margin of safety can also be provided by considering the additional bond length of the anchor zone. Thus, the values required for resisting the design loads are always greater than the calculated lengths.
Conclusion
In anchored systems, the design of ground anchors relies on assumptions regarding the tributary load area carried by the anchors, determined by the vertical and horizontal spacing between adjacent anchor retaining walls. Ensuring the capability of designed ground anchors to bear loads throughout their lifespan is crucial. Factors influencing strength include the anchor tendon's strength, length, diameter, grouting, and drilling procedures.
A project's specific requirements and constraints may lead to vertical and horizontal spacing variations. These considerations may include:
- The need for designing a highly stiff system, influencing low spacing between anchors to control lateral wall movement.
- Existing structures may impact the inclination and positioning of newly developed anchors.
- Categories of wall elements selected for the design.
The vertical positioning of the uppermost ground anchor is determined by considering the allowable cantilever deformation of the anchored wall. To minimize the potential for exceeding passive capacity, the vertical position of the uppermost anchor is carefully selected. Wall movement in retained grounds is observed when anchors are loaded at 133% of the design load during load testing.
Designing the uppermost ground anchor relatively larger for the design load is essential for resisting landslides and large surcharges. Exceeding passive capacity occurs in relatively weak or disturbed soils, leading to excessive movement of sheet piles or soldier beams in the retained ground.
To prevent grout leakage during the installation of pressure-grouted anchors, a minimum overburden of about 4.5m over the centre of the bond zone of the anchor is allowed, as depicted in the figure. This method effectively mitigates heave from high grouting pressures at ground surfaces.
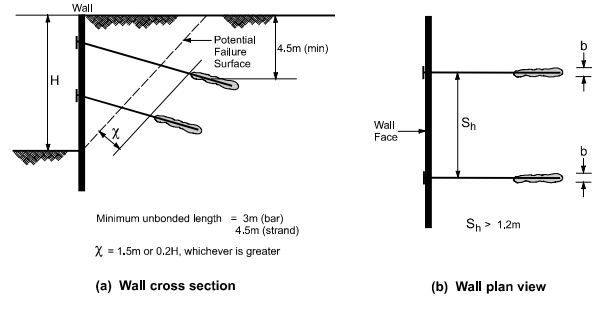
Figure 31: Vertical and horizontal anchor retaining walls
The horizontal spacing between two anchors is determined by the individual loads of the ground anchors and the flexural capacity of individual sheet piles or soldier beams. A typical horizontal spacing ranges from 1.5 to 3 meters for driven soldier beams, while for drilled-in soldier beams, it is 3 meters.
The figure illustrates a minimum horizontal spacing between adjacent anchors, emphasizing that avoiding drilling deviations can minimise the group effect at the anchor intersection and between adjacent ground anchors. Deploying the group effects of individual ground anchors has the potential to reduce the load-carrying capacity.
Get 3+ Free Dissertation Topics within 24 hours?
References
- Abramson, L. W., Boyce, G. M., Lee, T. S., & Sharma, S. (1993). "Advanced Course on Soil Slope Stability: Volume I, Slope Stability Manual.” Report FHWA-SA-94-005, Federal Highway Administration, Washington, D.C.
- American Society of Civil Engineers (1994) "Guidelines of Practice for Braced and Tied-back Excavations” Geotechnical Special Publication No. 74
- Andersen, T.C. (1984). "Earth Retention Systems, Temporary and Permanent, Meeting Preprint.”Proceedings of the 32nd Annual Soil Mechanics and Foundation Engineering Conference, Minneapolis, Minn
- Barley, A.D. (1997) “Discussion Session 3” Proceedings of the International Conference on Ground Anchorages and Anchored Structures, Thomas Telford Publishing, London, U.K., pp. 572
- Bruce, D.A. (1997). "The Stabilization of Concrete Dams by Post-Tensioned Rock Anchors: The State of American Practice.” Proceedings of the International Conference on Ground Anchorages and Anchored Structures” Thomas Telford Publishing, London, U.K., pp 508-521
- Bruen, M.P., Pansic, N., Schwartz, M.I. (1996). "Creeping Suspicion” Civil Engineering, ASCE, May, pp. 60-63.
- Christian, J.T. (1989). “Design of Lateral Support Systems” Proceedings, Seminar on Design, Construction, and Performance of Deep Excavations in Urban Area, Boston Society of Civil Engineers Section, ASCE
- CIRIA (1980). Design and Construction of Ground Anchors, 2nd ed, Construction Industry Research and Information Association, Report 65, London, U.K
- FHWA (1986). "Recommendations for Monitoring Applied Load During Permanent Anchor Testing.” Geotechnical Engineering Notebook, Guideline No. 12, Federal Highway Administration, Washington, D.C.
- Golder, H.Q., Gould, J.P., Lambe, T.W., Tschebotarioff, G.P., Wilson, S.D. (1970), “Predicted Performance of Braced Excavations,” Journal of the Soil Mechanics and Foundations Division, ASCE, Vol, 96, No, SM3, pp. 801-836.
- Hanna, T.H. (1982). Foundations in Tension, Ground Anchors, McGraw-Hill Book Company, Inc., New York, N.Y
- Institution of Civil Engineers (1997), Proceedings of the International Conference on Ground Anchorages and Anchored Structures, G.S. Littlejohn, Ed., Thomas Telford Publishing, London, U.K. 644 p
- Littlejohn, S (1992) “Ground Anchorage Technology - A Forward Look." Proceedings of the Conference on Grouting, Soil Improvement and Geosynthetics, Vol. 1, Geotechnical Special Publication No. 30, ASCE, New Orleans, Louisiana, pp. 39-62
- Ludwig, H.P. and Weatherby, D.E. (1989), "Behavior of a Tieback in Cohesive Soil” Proceedings of the 12th International Conference on Soil Mechanics and Foundation Engineering, A.A. Balkema, Brookfield, VT, pp. 1023-1026.
- Neelakantan, G., and Richards, R., Jr. (1992). "Balanced Seismic Design of Anchored Retaining Walls," Journal of Geotechnical Engineering, ASCE, Vol. 118, No. 6, pp. 873-888.
- Ostermayer, H. (1974). "Construction, Carrying Behavior and Creep Characteristics of Ground Anchors” Proceedings of the Conference on Diaphragm Walls and Anchorages, Institution of Civil Engineers, London, England, pp. 141-151.
- Prakash, S. and Basavanna, B.M. (1969), "Earth Pressure Distribution Behind Retaining Walls During Earthquakes.” Proceedings of the 4th World Conference on Earthquake Engineering, Santiago, Chile
- Reese, L.C. (1958). Discussion of "Soil Modulus for Laterally Loaded Piles.” by McClelland and Focht, Transactions, ASCE, Vol. 123, pp. 1071-1074.
- Reese, L.C., Cox, W.R. and Koop, F.D. (1974), "Field Testing and Analysis of Laterally Loaded Piles in Sand.” Paper No. OTC 2080, Proceedings of the 5th Offshore Technology Conference, Vol. II, Houston, Texas.
- Richards, R. Jr., and Elms, D.G. (1992), "Seismic Passive Resistance of Tied-Back Walls," Journal of Geotechnical Engineering, ASCE, Vol. 118, No. 7., pp. 996-1011.
- Romanoff, M. (1957), Underground Corrosion, Circular 579, National Bureau of Standards
- Romanoff, M. (1972), “Corrosion of Steel Pilings in Soils” Contained in National Bureau of Standards Monogram 127, NBS Papers on Underground Corrosion of Steel Pilings (1962-1972).
- Sharma, S. (1994) "XSTABL, An Integrated Slope Stability Analysis Program for Personal Computers.” Interactive Software Designs, Inc., Moscow, Idaho
- Siller, T.J. (1992) "Design of Tied-Back Walls for Seismic Loading" Journal of Geotechnical Engineering, ASCE, Vol. 118, No. 11, pp. 1804-1821.
- Siller, T.J., and Frawley, D.D. (1992) "Seismic Response of Multianchored Retaining Walls" Journal of Geotechnical Engineering, ASCE, Vol. 118, No. 11, pp. 1787-1803
- Skempton, A.W. (1964). "Long-Term Stability of Clay Slopes” Geotechnique, Vol. 14, No. 2, pp. 75-101
- Terzaghi, K. (1954). "Anchored Bulkheads” Transactions, ASCE, Vol. 119
- Weatherby, D.E. (1998). “Summary Report of Research on Permanent Ground Anchor Walls, Vol. 4, Conclusions and Recommendations” Report FHWA-RD-98-068, Federal Highway Administration, McLean, VA.
- Whitman, R.V. (1990). "Seismic Design of Gravity Retaining Walls” Proceedings of the Conference on the Design and Performance of Earth Retaining Structures, Geotechnical Special Publication No. 25, ASCE, pp. 817-842.
- Wright, S. (1995). "UTEXAS3, A Computer Program for Slope Stability Calculation - User's Manual." Shinoak Software, Austin, Texas
- Xanthakos, P.P. (1991). Ground Anchors and Anchored Structures. John Wiley & Sons, Inc., New York, NY.