


Literature Review Report
December 24, 2020
The Relationship Between Reverse Logistics And Customer Satisfaction
December 24, 2020
 Download PDF File
Examining the safety of the Edinburgh Trams Network in Scotland, UK. This assessment evaluates potential risks and safety measures for the project.
The following text comprises the introduction of the study.
Introduction
According to Serpella, et al. (2014), an effective and efficient risk management approach requires an appropriate and systematic methodology, knowledge, and experience.
-
Overview of Risk Management
The duty of a project manager includes the management of risk within a project which is complex and is considered inefficient if the process of risk management is not conducted from the initiation of the project (Serpella, et al., 2014, p. 654).
Construction projects are exposed to risks from the time of their coming into actuality and then through the various stages making it imperative to consider what risks the project owner would want to counter with appropriate measures and the cost of using those measures to counter the risks (Schieg, 2010).
Transport, Sustainability and Visions Cross Cutting Exercise
The current study will apply risk management techniques to the Edinburgh Trams Network (ETN) megaproject that began as an idea in 2003 and its first service starting in 2014.
-
Overview of Case Study
In January 2004, a proposal was submitted to the Scottish Parliament for the reintroduction of a tram network to Edinburgh which later received Royal Assent in the spring of 2006 through the Edinburgh Tram Line One and Two Act 2006. The proposed tramline consisted of three lines as illustrated in figure 1.
Extensive analysis by the Scottish Parliament led to the passage of the Act in March 2006 but funding for construction of the entire network was considered impossible by the Parliament and only two of the lines received parliamentary permission; Line 1a and Line 1b. By 2007 the Final Business Case for the Edinburg Trams Network (ETN) was passed by the City of Edinburgh Council (CEC) (Scotsman, 2007). A solely owned subsidiary by the CEC was formed in 2002; Transport Initiatives Edinburg (TIE) a private limited company was hired to deliver the tram system and other major projects of the CEC. Conclusion of contracts to begin building the tram networks were concluded in May 2008 and a construction deadline was given for the summer of 2011 with an estimated completion of £545 million (The Scotsman, 2007).
However, there have been multitudes of issues such as resulting in changes being made to the delivery of the original design plan noted in Figure 1. According to Johnson (2008) by April 2009, Phase 1b that were composed of tram lines between Roseburn and Granton Square was deferred because of the economic downturn during the period. Other issues such as delays, cost overruns, contractual disputes between TIE and Bilfinger Berger & Siemens (BBS), and funding issues resulted in extensive changes to the proposed route.
It was hypothesised by the CEC that the tram project would carry large volumes of passengers without being delayed by traffic due to their separate route system in addition to being environmentally friendly due to the system being electrically powered reducing vehicle emissions. The entire project’s summary of basic information is presented in Appendix A; the Stakeholder Relationship Map in Appendix B; and Environmental Analysis in Appendix C. The actual system became functional in 2014 and went over budget to a cost of £1 billion including loan interests.


According to the PMI (2008), an appropriate risk management analysis which can be beneficial for the project includes risk management planning, risk identification, qualitative risk analysis, quantitative risk, risk response planning, and risk monitoring and control.
Risk Management Requirements for Analysis
According to Banaitiene and Banaitis (2012), risk management is considered the most difficult aspect of project management as a project manager is required to have the capability to identify the root causes of risks and trace the causes through the project to their outcomes or consequences (p. 431). Furthermore, a typical process that is chosen to conduct risk management includes the following key steps (adopted from; Wysocki, 2009);
- Risk identification
- Risk assessment
- Risk mitigation
- Risk monitoring
Risk identification is the foremost step and is considered the most imperative within the risk management process as it attempts to identify the sources and types of risks (Wang & Chou, 2003). It is through risk identification that further steps of the process can be initiated such as analysis and control of risk (Wang & Chou, 2003; Wysocki, 2009; Banaitis, 2012). Risk management is effective through correct risk identification (Banaitiene & Banaitis, 2012).
Importance of Project Leadership in Managing the Risk in Offshore IT Outsourcing
The current study will go through the process of risk management to analyse the various risks that impacted the Edinburgh Trams Network (ETN) project. This process will start first with risk identification and continue with risk analysis/assessment to comprehend the risks that were present leading to cost and time overruns.
Risk Information and Data Collection
The current study uses the amplitude of data and sources to identify risk and compose a risk assessment analysis. The ETN project has been under a great deal of controversy since construction of the project began. Its constant time delay and overrun costs have brought it under fire throughout the Scottish government and publicly. The greatest source of information for the current study was the Edinburg Tram Inquiry web page developed to establish the reasons why the ETN project had incurred delays and cost more than it was originally budgeted. There are also preliminary hearings of the Edinburgh Tram inquiry that took place on 6th October 2015 which covered the process to date and the procedures for future oral hearings in regards to the project. The procedural hearings can provide a plethora of information about the project to identify the risks that were associated with the project and caused project delays. Information was also extracted from a council report (Kerr, et al., 2015) which detailed recommendations to the City of Edinburgh Council about the ETN project in terms of improving cost-effectiveness and project planning through risk assessment.
Risk Identification
According to An (2015), it is not possible to identify all the possible risks that can be associated with a construction project and it is also not possible to know for sure if all risks have been identified. The purpose of risk identification is to recognise the potential sources of risk for a specific project that are likely to have an impact on the project and a high probability of occurrence (An, 2015). For the current study, risk identification was conducted by brainstorming and using the “What if” process to identify potential risks (An, 2015). The risks were then categorised using STEEP (see Table 1); social, technical, economic, environmental, and political challenges which resulted in cost and schedule overruns for the ETN project. The categories of risk identified are discussed at length in section 6 of the report.
| Level 1 | STEEP Risks in the ETN Project | ||||
| Level 2 | Social | Technical | Economic | Environmental | Political |
| Level 3 |
· Social grievances · Multi-level decision-making bodies · Legal Actions · Social Issues · Threats to person and asset security |
· Ambiguity of project scope/scope changes · Ground conditions on given project sites · Inadequate project complexity analysis · Unforeseen modifications to the project · Inaccurate project cost estimate · Failure to meet specified standards · Project time overruns · Project cost overruns · Inadequate site investigation |
· Economic recession · Material price change · Foreign exchange rate · Energy price changes · Project delays in all forms · Wage inflation · Taxation changes · Project technical difficulties |
· Environmental issues from works (pollution) · Unfavourable climate conditions (rain, winds, snow, sleet, etc.) |
· Lack of political support · Political Opposition · Changes in government funding policy · Project termination · Political indecision · Delay in obtaining consent/approval · Legislative/regulatory changes · Delay in obtaining temporary Traffic Regulations Orders (TROs). |
Table 2- Risk Identification ETN Project using STEEP
Risk Analysis
Risk assessment is the process used under risk management which includes activities of identifying, assessing, mitigating, and managing various risks that exist in a project. The process of risk analysis is important to a project’s success. According to Bellasi and Tukel (1996) if there are no established processes the team of the project is considered to be operating with blindspots throughout the lifecycle of the project and they will be unprepared for what occurs as a resultant impact on the project scope, cost and schedule. Furthermore, contractual terms and conditions which are found to be vague are also considered as a significant factor for project failure. All parties that are participating in the project are going to misunderstand the requirements of the project leading to costly litigation processes.
Risk Management Dissertation Topics
Contractual risks, along with scope and project management risks have been identified throughout the ETN project. The risks were then quantified using a severity and frequency scale devised from a review of various literature (Bellasi & Tukel, 1996; Chen, et al., 2004; Banaitiene & Banaitis, 2012; Lee, 2008; Wysocki, 2009) for risk occurrence and severity in terms of time overruns and cost overruns.
Table 3- Scale of severity in terms of cost overruns (Banaitiene & Banaitis, 2012; Bellasi & Tukel, 1996; Vargas, 2013)
| Severity | Score | Description |
| Catastrophic | 5 | Variation (positive/negative) above £1,000,000 |
| Critical | 4 | Variation (positive/negative) between £500,000 and £1,000,000 |
| Moderate | 3 | Variation (positive/negative) between £250,000 and £500,000 |
| Minor | 2 | Variation (positive/negative? Between £100,000 and £250,000 |
| Negligible | 1 | Variation (positive/negative) lower than £100,000 |
Table 4- Scale of severity for time and deadlines (Vargas, 2013)
| Level | Score | Description |
| Very High | 5 | Delays/Anticipation above 180 days or 6 months |
| High | 4 | Delays/Anticipation between 120 days to 180 days. |
| Medium | 3 | Delays/Anticipation between 60 days to 120 days |
| Low | 2 | Delays/Anticipation between 15 days to 60 days |
| Very Low | 1 | Less than 15 calendar days of Delays/Anticipation |
Table 5- Scale of the probability of occurrence/frequency of risk (Banaitiene & Banaitis, 2012; Wysocki, 2009; Vargas, 2013)
| Frequency | Score | Probability of Occurrence | Description |
| Frequent | 5 | 90% or greater chance of occurrence | Hazard likely to occur |
| Probable | 4 | 65% chance of occurrence <90% | Hazard will be experienced |
| Occasional | 3 | 35% chance of occurrence <65% | Some manifestations of the hazard are likely to occur |
| Remote | 2 | 10% chance of occurrence <35% | Manifestations of the hazard are possible, but unlikely |
| Improbable | 1 | <10% chance of occurrence | Manifestation of the hazard is very unlikely |
Identified risks were then sorted to categorise which risks would be the most significant and impact the ETN project for cost overruns and time overruns. These selected risks were then used to calculate the threshold of risk using an expected value and a quadratic mean (root square mean) calculation (Vargas, 2013).
Expected Value= Probability x Impacts
Impact =
The variables of the impact equation, x, y, z, etc. are variable risks that impact the project. For the case of the ETN project, variables of time and cost were considered about the frequency of the risk occurring.
The calculated expected values have been illustrated below in the following table;
Table 6- Expected value of Risk for selected Hazards
| No. | Identified Risk | Cost Overrun Severity | Time Overrun Severity | The Probability | Expected Value of Risk |
| 1 | Ambiguity of project scope/scope changes (AS) | 5 | 5 | 5 | 50 |
| 2 | Inaccurate project cost estimate(ICE) | 4 | 5 | 5 | 45 |
| 3 | Ground conditions on given project sites (GPS) | 5 | 4 | 4 | 36 |
| 4 | Material price change (MPC) | 4 | 4 | 3 | 24 |
| 5 | Unfavourable climate conditions (UCC) | 4 | 4 | 3 | 24 |
| 6 | Delay in obtaining temporary Traffic Regulations Orders (TROs). (DTRO) | 4 | 4 | 5 | 40 |
| 7 | Contractual disputes (CD) | 3 | 5 | 4 | 32 |
| 8 | Economic recession (ER) | 4 | 5 | 4 | 36 |
| 9 | Political Opposition (PO) | 3 | 4 | 4 | 28 |
| 10 | Changes in government funding policy (CGFP) | 3 | 3 | 4 | 24 |
Based on the results of the tables above, a risk matrix was developed as illustrated below
| Probability of Occurrence | 5 | DTRO (40) | AS (50) | ICE (45) | ||||||||
| 4 | CGFP (24) | CD (32) | GPS(36) | ER (36) | PO (28) | |||||||
| 3 | MPC (24) | UCC (24) | ||||||||||
| 2 | ||||||||||||
| 1 | ||||||||||||
| 1 | 2 | 3 | 4 | 5 | 5 | 4 | 3 | 3 | 2 | 1 | ||
| Severity of impacts | ||||||||||||
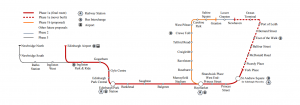
Figure 1- Risk Matrix for ETN Project
The quadratic value for impact has been separately calculated (see Appendix D). The final results of the total impact on the expected value have been illustrated in the table below.
| No. | Type | Identified Risk | Cost Overrun Severity | Time Overrun Severity | The Probability | Total Impact | Expected Value |
| 1 | Threat | (AS) | 5 | 5 | 5 | 5 | (50) |
| 2 | Threat | (ICE) | 4 | 5 | 5 | 4.69 | (45) |
| 3 | Threat | (GPS) | 5 | 4 | 4 | 4.36 | (36) |
| 4 | Threat | (MPC) | 4 | 4 | 3 | 3.70 | (24) |
| 5 | Threat | (UCC) | 4 | 4 | 3 | 3.70 | (24) |
| 6 | Threat | (DTRO) | 4 | 4 | 5 | 4.36 | (40) |
| 7 | Threat | (CD) | 3 | 5 | 4 | 4.09 | (32) |
| 8 | Threat | (ER) | 4 | 5 | 4 | 4.36 | (36) |
| 9 | Threat | (PO) | 3 | 4 | 4 | 3.70 | (28) |
| 10 | Threat | (CGFP) | 3 | 3 | 4 | 3.36 | (24) |
| Total Risk Expected Value | (339) | ||||||


Recommendations for Improvement
It is evident from the analysis of the literature that the ETN project had various consultations with industry leaders but there is no evidence of risk assessment and risk management from the initiation of the project. This led to cost overruns and time delays that had a significant impact on the support for the project and the government. Failure to conduct a risk assessment had led to various foreseeable risks to hurt the overall project lifecycle.
According to Chapman and Ward (2004), projects considered mega projects, particularly for improvements to the transportation system are composed of five subsystems;
- Social subsystem
- Technical subsystem
- Economic subsystem
- Environmental subsystem
- Political subsystem
Each of these subsystem need to work coherently and in harmony to maximise their performance and deliver results. Therefore, it is recommended that project managers of ETN should consider all these systems before the construction of the project to ensure that all factors are equally important and incorporated during the development of the project lifecycle.
From the standpoint of the Edinburg Tram Network Project, the risk management system needed to be established that also required organising and connecting all actors within the organisation that allow for project development and evolution. This means that for risk management to be successful all skilled actors within the appropriate organisational contexts and institutional arrangements need to be involved at all times (Charmaz, 2006). With the ETN project, there was a great deal of actors and according to Chapman (2001), the more actors the greater the incurred risk of having an insufficient or inappropriate structure.
Future Work
The mathematical process that was used to turn the results of qualitative risk analysis into a numerical indicator has aided the report a great deal in developing risk response strategies. It is recommended that future work is needed in this process to develop improved risk response strategies for mega projects such as the ETN project that was analysed. Based on the results that are obtained using this method and the tolerance thresholds that are composed, the total risk exposure can be compared with other mega projects of the same industry and other corporate limits to define potential risk response plans.
There is a need for future research to examine and investigate the dynamics of STEEP risks and the impacts that they have on project performance within the whole project lifecycle. The findings of the current study can be used by academic professionals and industrial stakeholders as a reflective report for comprehending the risks involved in a project, specifically a megaproject for the transportation industry, to appropriately implement risk assessment.
The recommendations devised in the current study can be implemented in future projects to ensure that risk management is taking place from the start of the project. Through implementation of the new recommendations, their feasibility and practicability can be assessed and then concluded if the recommendations can be used for the project management industry.
Guaranteed Plagiarism-Free Work
Get 100% human generated plagiarism-free research content from our expert writers!
Connect With Writer Now
Discuss your requirements with our writers for research assignments, essays, and dissertations.
Download PDF File
Appendix A
Summary of Basic Information of ETN Project
| Project Title | Edinburgh Tram Network Project |
| Location | Scotland, UK |
| Purpose |
· Support local economy by improving accessibility · Promote sustainability and reduce the environmental damage causes by congestive traffic · Reduce traffic congestion · Make transport system sager and secure for the daily commuter · Promotion of social benefits to the residents of Scotland |
| Scope |
The Tramline was constructed to be double track in order to connect: · Edinburgh Airport to the City Centre · Developmental areas in the North and West of Edinburg |
| Contractual Outline |
The major contracts are: · Development Partnering and Operating Franchise Agreement (DPOFA) · System Design Services (SDS) · Joint Revenue Committee (JRC) · Multi Utilities Diversion Framework Agreement (MUDFA) · Infrastructure Provide and Maintenance (INFRACO) · Vehicle Supply and Maintenance (TRAMCO) |
| Physical Dimension |
· Total length of route: 24 km (two phases) · Phase 1a: 18.5 km · Phase 1b: 5.5 km |
| Cost (£ million) |
· Originally planned project budget = 545 · Validated budget = 776 · Cost Variation = 231 · Actual budget = 1 billion |
| Year of Completion |
· Original Project planned date: 2011 · Actual Project completion date: 2014 |
Appendix B
Stakeholder Relationship Map for ETN Project
Figure 2- Stakeholder Relationship Map for ETN Project (Boateng, 2014)
Appendix C
Project Environmental Analysis of ETN Project
| Political Project Environment | The political project environment of the ETN had varied greatly as influence had changed based on the number of political seats or elected members within the City of Edinburgh Council (CEC) and the Scottish Parliament. |
| Legal and Regulatory Project Environment |
The project was governed by various legal and regulatory frameworks that extended regionally, nationally, and the European Union. The following are the frameworks that governed the project: · Edinburg Trams Acts · New Roads and Street Works Act (NRSWA) · Code of Construction Practice (Buildings, Roads, Bridges) · The Road Traffic Regulation for the Tram · The Local Authorities Traffic Orders, Regulations 1999 · Environmental Impact Assessment (Scotland) · Environmental Impact Assessment (EU Regulations) |
| Economic Project Environment |
Economic Project Environment for ETN was based on the economic benefits that are listed below: · Economic growth · Economic efficiency · Employment generation · Employment development · Reduction of Travel time · Residential Development |
Appendix D
Quadratic value for Risk Impact (Calculations)
| Impact Time | Impact Time ² | Impact Cost | Impact Cost² | Probability | Probability² | Mean | Root | Impact Score | ||
| Ambiguity of project scope/scope changes (AS) | 5 | 25 | 5 | 25 | 5 | 25 | 25 | 5 | 5 | |
| Inaccurate project cost estimate(ICE) | 5 | 25 | 4 | 16 | 5 | 25 | 22 | 4.69041576 | 4.69 | |
| Ground conditions on given project sites (GPS) | 4 | 16 | 5 | 25 | 4 | 16 | 19 | 4.35889894 | 4.36 | |
| Material price change (MPC) | 4 | 16 | 4 | 16 | 3 | 9 | 13.6666667 | 3.6968455 | 3.7 | |
| Unfavourable climate conditions (UCC) | 4 | 16 | 4 | 16 | 3 | 9 | 13.6667 | 3.69685001 | 3.7 | |
| Delay in obtaining temporary Traffic Regulations Orders (TROs). (DTRO) | 4 | 16 | 4 | 16 | 5 | 25 | 19 | 4.35889894 | 4.36 | |
| Contractual disputes (CD) | 5 | 25 | 3 | 9 | 4 | 16 | 16.6666667 | 4.0824829 | 4.09 | |
| Economic recession (ER) | 5 | 25 | 4 | 16 | 4 | 16 | 19 | 4.35889894 | 4.36 | |
| Political Opposition (PO) | 4 | 16 | 3 | 9 | 4 | 16 | 13.6666667 | 3.6968455 | 3.7 | |
| Changes in government funding policy (CGFP) | 3 | 9 | 3 | 9 | 4 | 16 | 11.3333333 | 3.36650165 | 3.36 |
Table 7- Quadratic Value of Risk Impact Calculated
Appendix E
Predefined Scale
| Level | Score | For Threats |
| High |
Very High High |
Red |
| Medium |
Medium Low |
Yellow |
| Low | Very Low | Green |
Table 8- Predefined Scale for qualitative risk analysis (Vargas, 2013)
Get an Immediate Response
Discuss your custom requirements with our writers
Get 3+ Free Custom Examples & Topics within 24 hours;
Free Online Plagiarism Checker For Students
We will email you the report within 24 hours.
Upload your file for free plagiarism