


Directional Drilling Technology
February 1, 2021
First half: Pneumatic Conveying System, Safety and Reliability
February 2, 2021
Simulating vehicle performances with diverse power systems enables engineers to assess efficiency, range, and emissions, optimising electric, hybrid, and combustion powertrains for sustainable, high-performing transportation solutions. In the rapidly evolving realm of automotive technology, the simulation of vehicle performances with distinct power systems has emerged as a pivotal catalyst for innovation and progress. This cutting-edge approach provides engineers with a virtual testing ground to meticulously analyze the intricacies of diverse powertrains. By harnessing simulation tools, engineers can delve into the nuances of electric, hybrid, and traditional combustion power systems, gaining valuable insights into efficiency, range, and environmental impact. This dynamic exploration is instrumental in shaping the future of transportation, paving the way for more sustainable and efficient solutions that align with the global shift towards greener mobility.
Environmental Impact Assessment
In this digital crucible, the simulation of diverse power systems transcends mere experimentation; it acts as a transformative force, guiding the trajectory of automotive development. Engineers can fine-tune and optimize each powertrain type, addressing challenges unique to electric, hybrid, and combustion vehicles. This streamlines the development process and propels the industry towards realising more eco-friendly and high-performing transportation solutions. As the automotive landscape continues its metamorphosis, the integration of simulation stands as a beacon, illuminating the path toward a future where innovation and sustainability converge seamlessly on the roadways of progress.


Introduction
This chapter underscores the imperative to curtail fossil fuel consumption, emphasizing the urgency of transitioning to alternative automotive power systems. With finite reserves of fossil fuels and the escalating costs associated with their energy production for transportation, shifting away from conventional petrol/diesel technologies toward hybrid and electric vehicles becomes an inevitable trajectory for the automotive industry. The recent notable transition indicates a paradigm shift towards sustainability. Hybrid vehicles, incorporating power electronics, embedded powertrain controllers, electric motors, and energy storage devices like ultra-capacitors and batteries, present a viable solution to enhance overall vehicle performance and energy efficiency.
The strategic use of advanced computer modelling and simulation before the prototyping phase is recommended to address the challenge of seamlessly integrating electric components into drive train configurations. This approach not only aids manufacturers in navigating complexities but also contributes significantly to cost reduction and enhanced safety during the design phase. This paper delves into the discussion of how modelling and simulation principles serve as a valuable platform to achieve hybrid vehicles' efficient and safe design.
Fossil fuel consumption extends beyond transportation, impacting various industries, including power and heating. Studies indicate an escalating demand for fossil fuels compared to the time required for energy conversion, so exploring alternative energy sources is imperative (Zaroofi, 2008). Furthermore, as highlighted by researchers such as Jalil (1997), the environmental ramifications of fossil fuel use necessitate urgent consideration. The detrimental environmental impact, including global warming and air pollution, underscores the importance of swiftly transitioning to alternative energy sources to address impending environmental challenges.
Hybrid Vehicles as an Alternative Solution
Given the environmental challenges outlined earlier and the integral role of transportation in our daily lives, there's a pressing need for a sustainable energy source with minimal carbon emissions. As previously discussed, using electric batteries and fuel cells for vehicle propulsion emerges as an economically feasible and environmentally friendly solution. Continuous advancements in power electronics technology and electric components now enable the recapture of renewable energy and the identification of more efficient operating parameters for vehicle combustion systems (Gao and Emadi, 2007). Additionally, various energy management methods can eliminate engine idling time.
The enhanced technology empowers hybrid vehicles to reduce emissions significantly, elevate overall efficiency and performance, and extend the life cycle of nearly all mechanical components. Considering the multitude of benefits associated with hybrid vehicles (HV), it's evident that this technology provides a cost-effective and reliable means to curb carbon emissions, enhance fuel economy, and meet customer demands for improved performance and comfort.
Hybrid Vehicle Background
In the early 19th century, the United States witnessed a market offering a variety of vehicles, including combustion-powered, electric, and steam-engine vehicles. However, the automotive landscape underwent significant changes as fossil fuels like petrol, diesel, and gas became widely accessible at competitive prices. Pioneers such as Edson, Westinghouse, and Edison led the electric car industry in the United States during this period (Williamson, 2004). In the 1890s and 1900s, it became apparent that electric batteries had limited scope and practicality, prompting manufacturers to prioritize the production of combustion-driven vehicles deemed more suitable for frequent travellers and long journeys.
The inception of hybrid cars in Europe dates back to 1901 when a Jenatzy parallel hybrid system, featuring a 6HP engine, drive, and a 14HP generator, was showcased at the Paris Motor Show. In 1903, a collaborative effort by Lohner Porsche produced another hybrid vehicle with a 21 kW DC Generator and a 20 HP engine, featuring electric motors in each front wheel. The subsequent introduction of the Mercedes Mixte, a collaboration between Mercedes and Lohner Porsche, occurred five to six years later. Unfortunately, due to technological limitations at the time, coupled with increased weight and cost, the production of hybrid cars eventually ceased.
Hybrid Vehicles Simulation
In comparing conventional and hybrid vehicles, the pivotal role of electric components, including embedded power train controllers, power electronic converters, supercapacitors, batteries, electric motors, and modern mechanical parts, cannot be overstated. Hybrid vehicle (HV) designs integrate these elements with internal combustion engines, presenting a comprehensive approach to improve overall cost-effectiveness, fuel consumption, reliability, and vehicle design (Williamson, 2004).
When engineers embark on designing new hybrid vehicles, the meticulous selection and integration of drive-train components are crucial. These components are then intricately controlled and modified to enhance cost-effectiveness, fuel efficiency, and vehicle reliability. However, achieving these goals is a complex process that may take engineers days or months to finalize. A critical aspect of this design process is creating a simulation environment for each drive train component or part. The simulation of individual components accurately reflects their actual behaviour, proving invaluable in refining designs and reducing vehicle costs.
Simulation and modelling are indispensable before prototyping and analyzing hybrid vehicles, especially when dealing with innovative hybrid power train controllers and configurations. This becomes even more critical when testing novel energy management systems and configurations through computer simulations, offering advantages such as cost reduction, design efficiency, and increased component life cycle. Computer simulations also provide a safer, more cost-effective alternative to executing dangerous, strategically undesirable, complex, and expensive tests and studies. Addressing concerns related to the dependence of power trains on various control strategies is another significant advantage computer simulations offer.
As the name suggests, hybrid vehicles utilise at least two energy sources, typically electric and combustion or heat energy. Achieving optimal power-sharing management between these sources is crucial for ensuring high-class performance. A hybrid vehicle's main components/parts include the transmission, control system, secondary energy converter, primary energy converter, primary energy storage system, and secondary energy storage system.
Principles/Rules of Modelling and Simulation
Comprehensive computer simulations are conducted for each vehicle type for each component, with users selecting from three modelling categories: quasi-state, dynamic, and steady-state models.
Quasi-state and steady-state models are primarily employed for long-term analyses over varying drive cycles, serving as valuable tools for making high-level operational decisions and architectural choices. Although these models allow for fast computations, they lack accuracy in dynamic simulations (Zaroofi, 2008).
In contrast, dynamic models focus on intricate details, such as lower-level comparisons among support subsystems and designs. Achieving accuracy in dynamic simulation is feasible as these models rely on the differential equations of the components. Studies highlight the essential use of dynamic modelling for achieving precise hybrid vehicle (HV) designs and determining the power requirements of all involved components. Given the higher switch frequency of power electronic devices in hybrid vehicles, dynamic modelling is recommended to compute the peak rating of these electronic components during operation.
Unlike steady-state models, dynamic modelling is recommended for rating components, calculating overall drivetrain efficiency, determining conduction, and estimating switching losses in power converters. Computer simulations encompass various aspects of interest for engineers and manufacturers, including modelling for packaging and cost, emissions, performance, prediction, and optimization for evaluating fuel consumption.
As the level of detail increases, the models become more sophisticated and intricate, potentially leading to a significant increase in simulation runtime. Understanding the relationship between simulation runtime and model complexity is crucial to achieving optimal results.
Drive Cycles
The drive cycle command proves immensely advantageous as it encapsulates the pattern dictated by a scheduled speed. Drive cycle assumptions posit that acceleration remains constant during the time step, resulting in speed being a linear function of time. Consequently, the required mechanical energy can be determined as a function of time, given the known acceleration and speed at each time point. The formula for the mechanical energy function over time will be explored later (Sandberg, 2001). For motorway driving cycles, a dynamometer may be employed. In the case of internal combustion engine (ICE) driven vehicles, emissions and fuel consumption are directly calculated. It is important to note that primary energy is computed from the fuel consumption.
CVT
Continuously Variable Transmission (CVT) is an automatic transmission type that enhances fuel economy, amplifies power and delivers a superior driving experience compared to conventional transmission systems (CVT, 2013).
MATLAB
MATLAB is a mathematical software that is extensively utilized for numerical calculations and visualization. MATLAB emerges as the clear and preferred choice when dealing with programs that involve fundamental data elements such as matrices and array-based data.


Diesel and Petrol Engine Performance
This chapter undertakes a performance analysis comparing diesel and petrol engines. The assessment uses the European NEDC, American FTP-75, and rigorous US-06 test cycles.
Petrol Engine Tests
Petrol engine tests involve rigorous evaluations using standardized protocols such as the European NEDC and American FTP-75 test cycles. These assessments provide crucial insights into the performance and efficiency of petrol-powered vehicles under varying driving conditions.
NEDC Drive Cycle
Following is the Petrol Engine NEDC drive cycle:
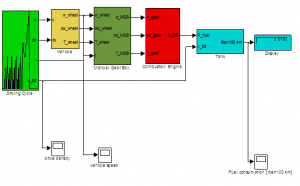
Figure 1: The model of a petrol engine drive in the QSS TB form
The results of the Petrol engine fuel consumption rate for the subject test cycle are given below in Figure 2
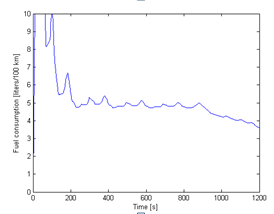
Figure 2: Fuel consumption of petrol engine [litre/100 km]
Figure 1 and Figure 2 show that the fuel consumption rate is highest at the start of the engine cycle (time between 0 to 100 seconds), which eventually stabilizes with time. The final and/or lowest fuel consumption rate per 100 km is reached at 1200 seconds, 3.6181 litres/100km.
FTP-75 Driver Cycle
Following is the petrol engine FTP-75 drive-cycle:
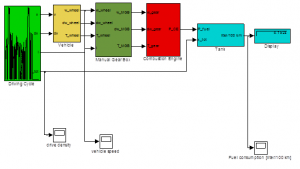
Figure 3: The .mdl of a petrol engine drive in the QSS TB form
The results of the Petrol engine fuel consumption rate for the subject test cycle are given below in Figure 4
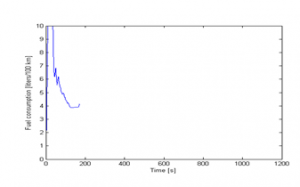
Figure-4: Fuel consumption [litre/100 km]
Figures 3 and 4 illustrate that the fuel consumption rate is highest at the start of the engine cycle (time between 0 to 60 seconds), which eventually stabilizes with time. The final fuel consumption rate of 4.1521 per 100 km is reached at the time of 180 seconds approximately.
US-06 Driver Cycle
Following is the petrol engine US- 06 drive cycle:
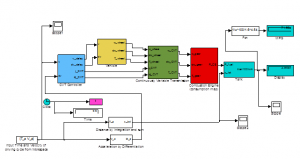
Figure 5: The .mdl of a petrol engine drive in the QSS TB form
The results of the Petrol engine fuel consumption rate for the subject test cycle are given below in Figure 6
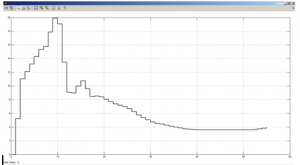
Figure-6: Fuel consumption [litre/100 km]
From the US-06 test cycles illustrated in the figures above, it can be seen that the fuel consumption rate reaches its peak near the start cycle, with time between 0 to 12 seconds, stabilising with passing time. The final fuel consumption rate of 3.9451 for every 100 km is reached at 55 seconds.
Diesel Engine Tests
Following is the Diesel Engine NEDC drive cycle:
DRIVER CYCLE NEEDS
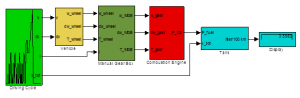
Figure -7: The .mdl of a diesel engine drive in the QSS TB
The results of the Diesel engine fuel consumption rate for the NEDC test cycle are given below in Figure 8;
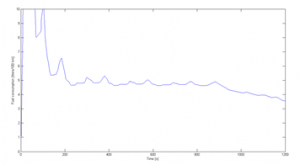
Figure-8: Fuel consumption [litre/100 km]
From the Figures above, the NEDCS test cycles show that the fuel consumption rate reaches its maximum with time between 0 and 150 seconds, which then decreases. The final and lowest fuel consumption rate of 3.5561 for every 100 km is reached at 1200 seconds.
Driver Cycle FTP-75
Similarly, the following is the Diesel Engine FTP-75 drive cycle
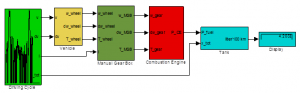
Figure 9: The .mdl of a diesel engine drive in the QSS TB
In a graphical form, the results of the Diesel engine fuel consumption rate for the FTP-75 test cycle are given below in Figure 10;
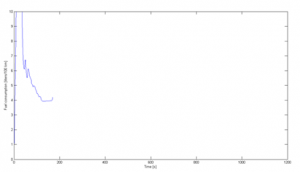
Figure-10: Fuel consumption [litre/100 km]
Figure 9 and Figure 10 shows that the fuel consumption rate is highest at the start of the engine cycle (time between 0 to 90 seconds), which eventually reduces and stabilizes with time. The final fuel consumption rate per 100 km is reached at the time of 180 seconds approximately, which is 4.2031 litres/100km.
Consideration of Driver Behavior in Traffic Simulation
US-06 Driving Cycle
The Diesel Engine US 06 drive cycle is given below;
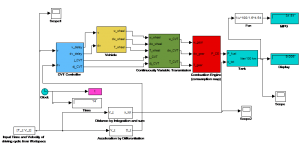
Figure-11: The .mdl of a petrol engine drive in the QSS TB
The results of the Diesel engine fuel consumption rate for the US 06 test cycle in a graphical form are given below in Figure 12
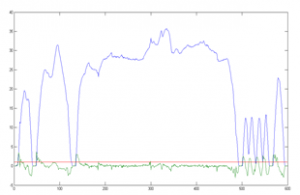
Figure-12: US 06 Driving Cycle
The two Figures above show variations in fuel consumption rates in a form cycle. The pattern was calculated for 600 seconds, and a mean/average value of 9.006 fuel consumption rate per 100 km was calculated for the overall test cycle.
Comparative Summary of Test Cycles
Following is the comparison of the two engine types in tabulated form;
Table 1; Summarized Comparison
| Test Cycle | Petrol Engine; Fuel Consumption rate | Diesel Engine; Fuel Consumption rate |
| NEDC | 3.6181 | 3.5561 |
| FTP-75 | 4.510 | 4.2031 |
| US 06 | 3.9451 | 9.006 |
For an easy presentation, the figure below has been generated to present the difference between the two engine types for each test cycle.
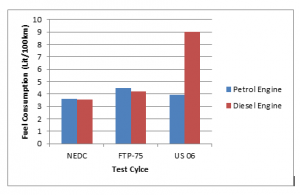
Figure-13: Test cycles comparison
Figure 13 shows that the petrol engine and diesel engine show similar consumption rates for the NEDC test cycle, with a petrol engine fuel consumption rate of 0.062 lit/100km higher than the diesel engine. Similarly, for the FTP-75 test cycle, the petrol engine has a higher consumption rate, with the difference being 0.3069 lit/100km. However, for the US 06 test cycles, the difference between petrol engine and diesel engine consumption rates is quite significant, where the diesel engine consumption rate is 5.0609 lit/100km higher than the petrol engine.
Optimized Transmission Design
This chapter presents the respective NEDC and FTP-75 test cycle simulation results using the optimization toolbox function.
Petrol Engine
Petrol or gasoline engines are internal combustion engines that run on petrol fuel. Widely used in automotive applications, these engines ignite a mixture of air and petrol to generate power, offering a balance of performance, efficiency, and responsiveness in various vehicles.
NEDC Drive Cycle
The following figure represents the NEDC drive cycle for a petrol engine with a CVT Controller through the optimization toolbox function;
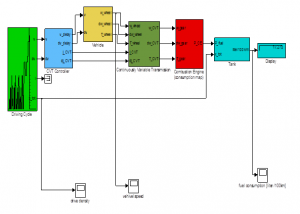
Figure 14: The .mdl of a petrol engine drive in the QSS TB
The figure below shows the plot of the resulting speed and torque distribution on the combustion engine map for the same drive cycle;
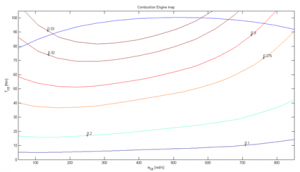
Figure 15: Combustion Engine map
Consumption maps: The traditional unit used by the manufacturers to describe the fuel consumption rate is g/kWh since it is a convenient way to compare the efficiency of engines. This method is quite useful when the engine is producing power but not when the engine is dragging.
FTP-75 Drive Cycle
The FTP -75 drive cycle for a petrol engine with CVT Control is as follows:
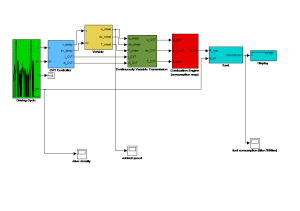
Figure 16: The .mdl of a petrol engine drive in the QSS TB
Similarly, the figure below shows the plot of the resulting speed and torque distribution on the combustion engine map for the same drive cycle;
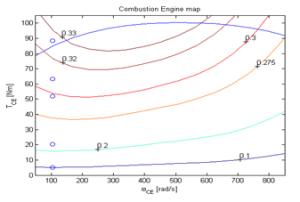
Figure 17: Combustion Engine map
Diesel Engine
Diesel engines are internal combustion engines that utilize diesel fuel. Known for their efficiency and torque, diesel engines operate by compressing air and igniting the injected diesel fuel. Widely employed in various vehicles, they are recognized for their fuel efficiency and longevity.
NEDC Drive Cycle
The following figure represents the NEDC drive cycle for a diesel engine with a CVT Controller and Optimal Transmission Design
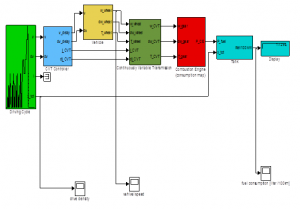
Figure 18: The model of a diesel engine drive in the QSS TB
The figure below shows the plot of the resulting speed and torque distribution on the combustion engine map for the same drive cycle;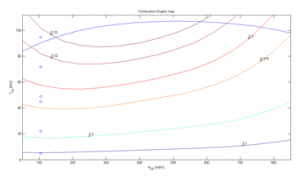
Figure 19: Combustion Engine map
Comparative Summary of Test Cycles
Following is the comparison of the two engine types in tabulated form;
Table 2; Summarized Comparison
| Test Cycle | Petrol Engine; Fuel Consumption rate | Diesel Engine; Fuel Consumption rate |
| NEDC | 3.3320 | 10.050 |
| FTP-75 | 4.1520 | 4.2030 |
For an easy presentation, the figure below has been generated to present the difference between the two engine types for each test cycle.
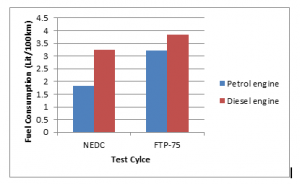
Figure 20: Graphical presentation of results
From the figure and the table above, it can be concluded that both the petrol engine and diesel engine fuel consumption rates have improved due to improved gearing (from comparison of Table 1 and Table 2). For the NEDC test cycle, the diesel engine fuel consumption rate is 06.718 lit/100km higher than the petrol engine. Similarly, for the FTP-75 test cycle, the diesel engine has a higher consumption rate, with the difference being 0.0510 lit/100km compared to a petrol engine.
Series Hybrid Vehicles
This chapter will showcase and analyze the simulation results of a series of hybrid vehicle performances.
Petrol Engine Series Hybrid
In a petrol engine series hybrid configuration, the internal combustion engine acts as a generator to recharge the battery, which powers an electric motor that propels the vehicle. This hybrid setup offers increased fuel efficiency and reduced emissions by optimizing the operation of the petrol engine for optimal efficiency and performance. The series hybrid design allows for seamless integration of electric power, particularly during low-speed or stop-and-go driving conditions.
NEDC Drive Cycle
The NEDC drive cycle petrol engine is given as below:
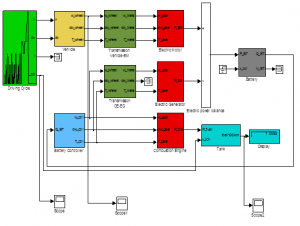
Figure 21: The .mdl of a petrol engine drive in the QSS TB
The figure below shows the plot of the resulting speed and torque distribution on the combustion engine map for the same drive cycle;
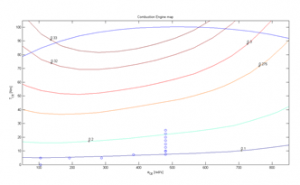
Figure 22: Combustion Engine map
The figure below shows the plot of the resulting speed and torque distribution on the electric generator map for the same drive cycle;
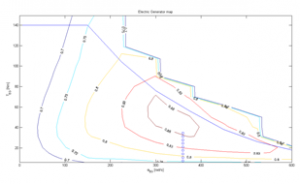
Figure-23: Electric generator map
Similarly, the figure below shows the plot of the resulting speed and torque distribution on the electric motor map for the same drive cycle;
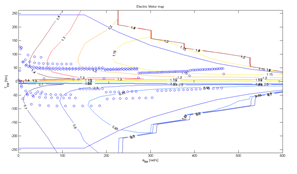
Figure-24: Electric motor map
Similarly, the following figures represent the battery charge ratio, battery voltage, battery current and battery power simultaneously concerning time for the same drive cycle;
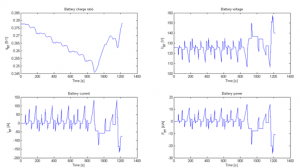
Figure-25: Battery statistics
FTP-75 Drive Cycle
Series Hybrid Vehicle Petrol for FTP-75 drive cycle is given below:
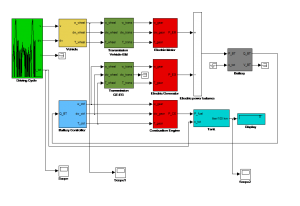
Figure-26: The .mdl of a petrol engine drive in the QSS TB
The figure below shows the plot of the resulting speed and torque distribution on the combustion engine map for the same drive cycle;
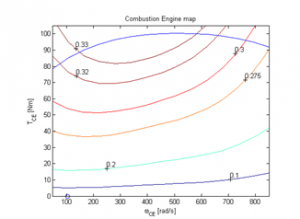
Figure-27: Combustion Engine map
Diesel Engine Series Hybrid
In a diesel engine series hybrid configuration, the diesel engine operates as a generator, charging the battery to power an electric motor that propels the vehicle. This hybrid setup optimizes fuel efficiency by leveraging the diesel engine's efficiency for consistent power generation, making it an eco-friendly option with lower emissions and enhanced overall performance.
NEDC Drive Cycle
The NEDC drive cycle for the Diesel engine is as follows:
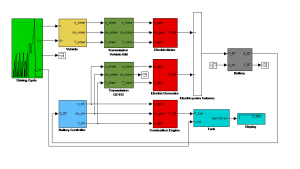
Figure 28: The .mdl of a diesel engine drive in the QSS TB
The figure below shows the plot of the resulting speed and torque distribution on the combustion engine map for the same drive cycle;
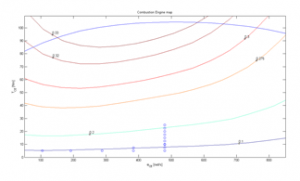
Figure 29: Combustion Engine map
FTP-75 Drive Cycle
FTP-75 drive cycle for the Diesel engine is as follows:
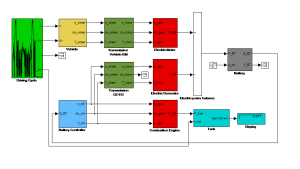
Figure 30: The .mdl of a diesel engine drive in the QSS TB
The figure below shows the plot of the resulting speed and torque distribution on the combustion engine map for the same drive cycle;
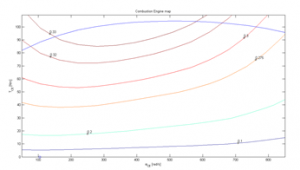
Figure-31: Combustion Engine map
Comparative Summary of Test Cycles
Following is the comparison of the two engine types in tabulated form;
Table 3; Summarized Comparison
Test Cycle | Petrol Engine; Fuel Consumption rate | Diesel Engine; Fuel Consumption rate |
NEDC | 1.5590 | 2.3940 |
FTP-75 | 4.5100 | 3.0110 |
For an easy presentation, the figure below has been generated to present the difference between the two engine types for each test cycle.
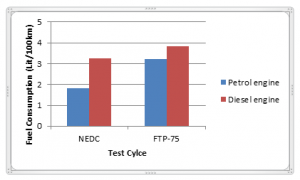
Figure-32: Series Hybrid Vehicle Graphical presentation of results
From the figure and the table above, it can be concluded that both the petrol engine and diesel engine fuel consumption rates have improved through hybrid vehicles. For the NEDC test cycle, the diesel engine fuel consumption rate is 0.835 lit/100km higher than the petrol engine. However, for the FTP-75 test cycle, the petrol engine has a higher consumption rate, with the difference being 1.499 lit/100km compared to the diesel engine.
Parallel Hybrid Vehicle with a 1.8 Litre Diesel Engine
This chapter will present and discuss simulation results for parallel hybrid models with a 1.8-litre diesel engine.
Parallel Hybrid Vehicle
In a parallel hybrid vehicle, the internal combustion engine and an electric motor are mechanically connected to the vehicle's transmission, allowing them to work together to propel the vehicle. This design enables seamless transitions between the gasoline engine and electric motor, optimizing fuel efficiency and performance in various driving conditions.
NEDC Drive Cycle
NEDC Drive cycle for a parallel hybrid vehicle with a 1.8 diesel engine is as follows:
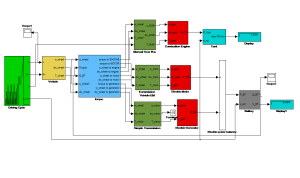
Figure-33: The model of a parallel hybrid diesel engine drive in the QSS TB
The fuel consumption rate concerning time is given in the following figure:
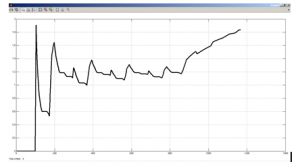
Figure-34: Fuel consumption [litre/100 km]
FTP-75 Drive Cycle
Drive cycle FTP-75 for a parallel hybrid vehicle with a 1.8 diesel engine is as follows;
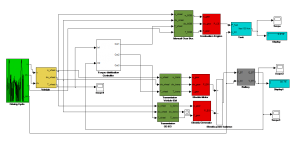
Figure 35: The model of a parallel hybrid diesel engine drive in the QSS TB
The fuel consumption rate concerning time is given in the following figure;
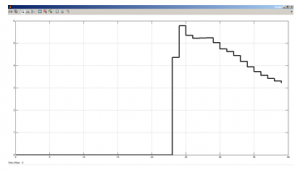
Figure-36: Fuel consumption [litre/100 km]
Diesel Engine
Diesel engines are internal combustion engines that utilize diesel fuel. Renowned for their efficiency and torque, these engines compress air to ignite injected diesel fuel, making them widely employed in diverse vehicles, appreciated for their fuel efficiency and extended lifespan.
NEDC Drive Cycle
NEDC Drive cycle for diesel engines is as follows:
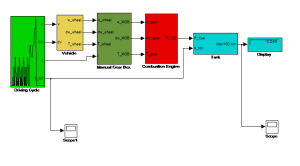
Figure-37: The model of a diesel engine drive in the QSS TB
The fuel consumption rate concerning time is given in the following figure;
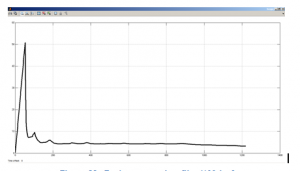
Figure-38: Fuel consumption [litre/100 km]
FTP-75 Drive Cycle
The FTP-75 cycle for diesel engines is as follows:
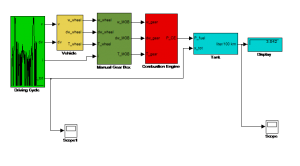
Figure-39: The .mdl of a diesel engine drive in the QSS TB
The fuel consumption rate concerning time is given in the following figure:
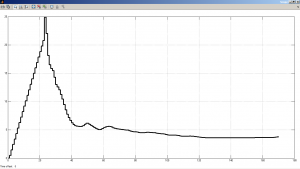
Figure 40: Fuel consumption [litre/100 km]
Comparative Summary of Test Cycles
Following is the comparison of the two engine types in tabulated form;
Table 4: Summarized Comparison of Parallel Hybrid Vehicle and Diesel Engine
Test Cycle | Parallel Hybrid Diesel Engine; Fuel Consumption rate | Diesel Engine; Fuel Consumption rate |
NEDC | 1.8360 | 3.2480 |
FTP-75 | 3.2180 | 3.8420 |
For an easy presentation, the figure below has been generated to present the difference between the two engine types for each test cycle.
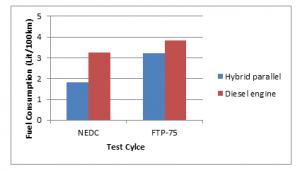
Figure 41: Parallel Hybrid Vehicle and diesel engine presentation of results
From the figure and the table above, it can be concluded that the hybrid vehicle's fuel consumption rate is considerably less than that of standard 1.8-litre diesel engines. For the NEDC test cycle, the diesel engine fuel consumption rate is 1.412 lit/100km higher than the parallel hybrid vehicle diesel engine. Similarly, for the FTP-75 test cycle, the diesel engine has a higher consumption rate, with the difference being 0.624 lit/100km compared to the parallel hybrid vehicle diesel engine.
Conclusion
The project aimed to compare the performance of diesel and petrol engine-powered cars using MATLAB simulations. Additionally, evaluations were conducted for a series of hybrid vehicles with petrol and diesel engines, along with a comparison between a parallel hybrid vehicle with a 1.8 diesel engine and a standard 1.8 diesel engine in terms of fuel consumption. Simulation results indicated that different test cycles yielded varied outcomes, but there was minimal discernible difference in fuel consumption performance between petrol and diesel engines.
The simulations revealed that fuel consumption efficiency improved with enhanced gearing. Particularly noteworthy was the finding that hybrid vehicles with 1.8-litre diesel engines demonstrated significantly better efficiency than their standard counterparts. Therefore, using hybrid cars with improved gearing is the most efficient option, emphasizing its pivotal role in advancing vehicle engine technology.
References
Blanchard, B. S., (2006). “Systems Engineering and Analysis: Fourth Edition,” Prentice Hall. International Series in Industrial and Systems Engineering.
CVT., (2013). “Continuously Variable Transmission”, Available online at: <http://cars.about.com/od/thingsyouneedtoknow/a/CVT.htm> [Retrieved on 14 August 2013]
Car reviews, (2013). “ASX Crossover 1.8 DiD 4 2WD Black 5dr”. Available online at:<http://www.whatcar.com/car-reviews/mitsubishi/asx-crossover/1-8-did-4-2wd-black-5dr/specifications/64834#tabsection2> and <http://www.mitsubishi-cars.co.uk/asx/specifications.aspx?Variant=PB6> [Retrieved on 11 August 2013]
Driving cycles, (2013), “ Driving cycles introduction”. Available online at: www.metricmind.com/data/cycles.pdf [Retrieved on 9 August 2013]
Gao, W., Mi, C. and Emadi, A., (2007). “Modeling and Simulation of Electric and Hybrid Vehicles”, Proceedings of the IEEE, Vol. 95-4.
Henson, W., (2008). “Optimal battery/ultracapacitor storage combination”, J. Power Sources.
Jalil, N., Kheir, N.A., Salman, M., (1997). ”A Rule-Based Energy Management Strategy for a Series Hybrid Vehicle”. Proceeding of American Control Conference, Vol.1.
Nelson, R., (2000). “Power requirements for batteries in hybrid electric vehicles”. J. Power Sources 91, 2–26.
Sandberg, T., (2001). “Heavy Truck Modeling for Fuel Consumption Simulations and Measurements”. Available online at <http:130.236.48.54/en/Publications/Lic/01_LIC_924_TS.pdf> [Retrieved on 14 August 2013]
Volkswagen Polo, (2013). “VX Polo1.2 60 S 3dr hatchback petrol”. Available online at: <http://www.buyacar.co.uk/volkswagen_polo_hatchback/car_12_60_s_3dr_16575.jhtml> [Retrieved on 10 August 2013]
Williamson, S., Rimmalapudi, C., Emadi A., (2004). “Electrical Modeling of Renewable Energy Sources and Energy Storage Devices”. Journal of Power Electronics, Vol.4, No.2.
Zoroofi, S., (2008). “Modeling and Simulation of Vehicular Power Systems”, Master’s Thesis in Electric Power Engineering Chalmers university of technology, Göteborg, Sweden
Get 3+ Free Dissertation Topics within 24 hours?