
Safety Culture in Maritime Industry: A Case Study of Nigeria
June 4, 2022
Impact of Leadership Style on the Job Satisfaction of Nurses
June 5, 2022
 Download PDF File
Embarking on a journey through the intricacies of healthcare in Kuwait, we navigate the landscape of medication errors in government hospitals, unravelling challenges and crafting pathways to precision in our pursuit of patient safety. In healthcare, ensuring the accurate administration of medications is pivotal for safeguarding patient well-being. Kuwait's government hospitals, like healthcare systems globally, confront the intricate challenges associated with medication errors. This blog aims to spotlight these challenges and propose effective solutions to enhance the medication administration process, recognizing the universal importance of minimizing errors in prescribing, dispensing, and administering medications to protect patient safety.
Significant Learning Experience in Healthcare
Delving into the nuances, this exploration will dissect the multifaceted challenges within Kuwait's government hospitals, ranging from communication barriers to staffing shortages and outdated technology. The intent is not solely to illuminate issues but to catalyze a dialogue on practical solutions. By pinpointing these challenges, we set the stage for a constructive discussion on implementing measures to fortify the medication administration process in Kuwait's government healthcare facilities. Pursuing excellence in healthcare necessitates a proactive approach, and in the subsequent sections, we will propose strategic solutions to fortify the foundations of medication safety in Kuwait's healthcare landscape.


Overview
This research chapter examines the effectiveness of Kuwait government hospitals and their healthcare professionals concerning the frequency of medication errors and associated complaints. Through data analysis, a direct correlation is established between efficiencies and the occurrence of medication errors, offering insights to aid Kuwait Government hospitals in error reduction.
Factors Responsible for Leadership Gap in Healthcare System
Methodological rigour is maintained, employing appropriate tools to collect, analyze, and interpret data for conclusive findings. The careful selection of research methods aligns with the study's objectives, ensuring the validity of the results. The subsequent section outlines the key methodologies employed in collecting and analyzing data.
Variables of the Study
This study relied on primary data sources to obtain comprehensive information about various variables. The researcher used relevant sources to gather pertinent data, focusing on key variables such as hospital efficiency, incident reports, complaints, and professional evaluations. Six hospitals were targeted to gather the necessary information, and the data collection process involved the observation method.
The researcher assessed the efficiency levels of professionals in three main categories: doctors/physicians, pharmacists, and nurses. Initial data collection included observations of medication errors in various hospitals under the Kuwait Government. Additionally, data on the number of medication error incidents and complaints were collected from diverse healthcare institutions.
The collected data was then categorized based on standard scales to evaluate the efficiency variables of both hospitals and professionals. The chosen data collection method facilitated the quantification of data, allowing the researcher to present factual information about the research topic.
Data Processing and Analysis Techniques
Processing and analyzing data constitute a critical phase in research, influencing the credibility and reliability of research findings (Cole and Trinh, 2017). Therefore, selecting appropriate analysis and processing techniques is pivotal in achieving the primary research objective. Given the quantitative nature of the collected data in this study, the researcher employed various statistical techniques for interpreting the quantitative information.
Initially, the researcher organized the total number of observations from each of the six hospitals within each variable category. All relevant data about different variables investigated in various hospitals were systematically arranged during the early stages of data analysis. This approach facilitated the identification of issues with the selected data and potential gaps in information.
Subsequently, the data underwent analysis using SPSS software, where it was imported for further examination. The researcher coded the data for each category of variables, encompassing hospital efficiency, reported incidents and complaints, and professional efficiency. The statistical tests conducted in this study included descriptive statistics, ANOVA analysis, homogeneity of variances, means plot, and assessment of the robustness of equality of means.
Data Analysis
Data analysis is the scientific sculptor of raw information, moulding disparate data points into a cohesive masterpiece. It's the decoding of a silent language, where patterns whisper and relationships speak, offering a unique lens to perceive the underlying story. Like investigative artists, researchers wield statistical brushes and qualitative chisels to reveal the hidden contours within the dataset canvas. In this process, the seemingly mundane numbers metamorphose into vibrant understanding hues, crafting a visual symphony that only the discerning eye of analysis can fully appreciate.
Overview of the Data Analysis
While various techniques exist for data analysis, selecting an appropriate method hinges significantly on the nature of the data under investigation (Kumar, 2019). In this study, the principal objective of data analysis is to assess the statistical significance of the gathered data. To achieve this, the researcher has employed diverse statistical tests to meticulously scrutinize the data and present precise, factual information about the research topic. The analysis encompasses the examination of variations in mean values, the determination of statistical significance, and the testing of homogeneity of variances.
Furthermore, a One-way ANOVA test has been conducted to ascertain whether the mean values of all dependent variables are comparable across different groups. The critical statistical tests conducted in this study include descriptive statistics, a test for homogeneity of variances, a means plot, and an assessment of the robustness of equality of means. This study section outlines the overarching data analysis outcomes for each variable under investigation. Additionally, it offers graphical representations of the results for various variables to enhance the clarity of the research findings.
Evaluation of Efficiency of Hospitals
The evaluation of the efficiency of hospitals involves assessing factors such as resource utilization, patient outcomes, and operational processes. Metrics like bed occupancy rates, patient wait times, and cost-effectiveness are commonly used to gauge healthcare facilities' overall efficiency and performance. Analyzing these indicators aids in identifying areas for improvement and optimizing healthcare delivery.
Categorized by Hospitals
Data for this study is sourced from six Kuwaiti government hospitals, focusing on assessing their efficiency and documenting reported medication errors and prevalent complaints. The evaluation of these hospitals revolves around the collected data, aiming to discern potential differences in efficiency that may impact incidents of medication errors. Methodologically, the assessment involves employing descriptive statistics, testing homogeneity of variances, conducting ANOVA analysis, and utilizing robustness measures, including mean plots, to evaluate the hospitals' efficiency comprehensively.
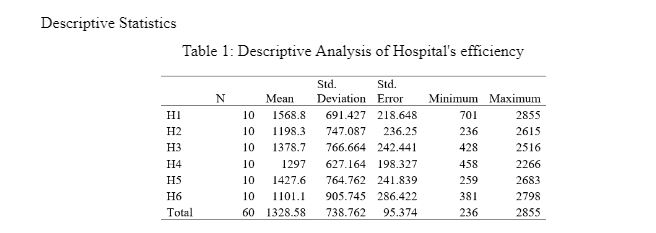
Table 1 outlines the descriptive statistics about hospital efficiency across various dimensions. Descriptive analysis, a widely utilized tool for data interpretation, condenses information into means for enhanced clarity (Amrhein, Trafimow, and Greenland, 2019). The analysis in this study is derived from data collected from six hospitals.
About H1, the first hospital's computed mean efficiency is 1568.8, with a maximum value of 3000, indicating slightly above-average efficiency. The standard deviation is 691.42, suggesting potential fluctuations in H1's efficiency. The efficiency range spans from a minimum of 701 to a maximum of 2855. For H2, the mean efficiency is 1198.3, below the threshold of 3000, hinting at potential challenges in reporting medication errors. The standard deviation is 747.08, indicating variability in efficiency. The efficiency range for H2 extends from 236 to 2615.
Moving to H3, the mean efficiency is 1378.7, below 3000, signalling weak efficiency in error reporting. The standard deviation is 766.6, suggesting variability in the hospital's efficiency. H3's efficiency ranges from a minimum of 428 to a maximum of 2516. Analyzing H4, the mean efficiency is 1297, notably lower than the overall average. The standard deviation is 627.16, indicating potential fluctuations in H4's efficiency.
Considering H5 and H6, the mean efficiencies are 1427.6 and 1101.1, respectively, with standard deviations reflecting potential variations (764.75 for H5 and 905.74 for H6). Both suggest areas of potential improvement in efficiency. Based on mean values, H1 stands out with the highest efficiency among the six hospitals.
Test of Homogeneity of Variances
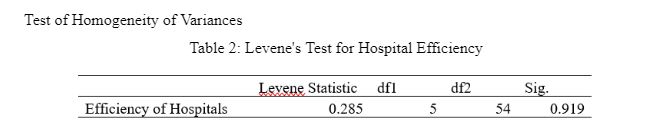
The assumption of homogeneity of variance is a second statistical assumption that requires to be tested while comparing three or more groups on an outcome through ANOVA. The standard tool used for measuring the assumption of homogeneity of variance is Levene's Test, in which the p-value must be above 0.05 to meet the assumption. In contrast, the value below violates the assumption (Jayalath et al., 2017). Based on the results, the significance value is computed as 0.919, and the null hypothesis is accepted. The variance among the different Kuwaiti government hospitals regarding their efficiency is equal.
One-Way ANOVA
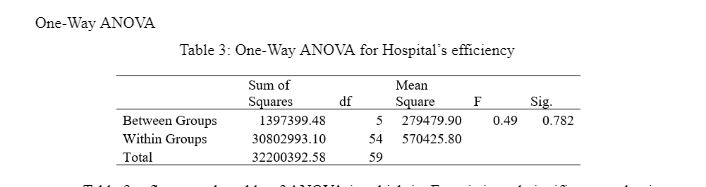
Table 3 reflects the table of ANOVA in which its F-statistic and significance values are evaluated. The null hypothesis of the case is that the mean value of the hospital's efficiency is the same for all groups. Concerning the significance value, it is computed as 0.782 and is above the threshold value of 0.05. This means that the null hypothesis is accepted in that the mean value for the hospital's efficiency is the same for all the groups.
Robustness of Equality of Means
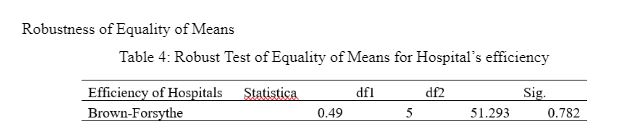
The robust Test is similar to Levene's Test, which tests the equality of the means using deviations from the group's medians (Karagö and Saraçbasi, 2016). The robust equality test of means has been evaluated through the sig value of 0.782 (p-value >0.05). Therefore, the null hypothesis is accepted because all the groups' means are equal.
Means Plot
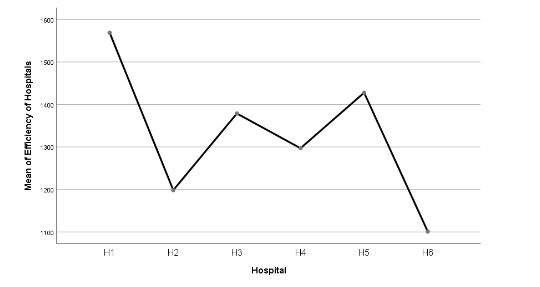
Figure 1 represents the mean plots of the efficiency of the six Kuwaiti government hospitals. It is identified that the H1 has the highest mean value compared with the other hospitals. This also implies that the H1 has the highest efficiency level in error reporting compared to the other hospitals. On the contrary, H6 has the lowest mean point of efficiency of hospitals, indicating having the least efficiency.


Categorized by Scale
This section measures efficiency based on the developed scale where 1 equals bad efficiency, and 10 indicates perfect efficiency. The purpose is to demonstrate the aspects of efficiency employed in the hospital based on the scale.
Descriptive Statistics
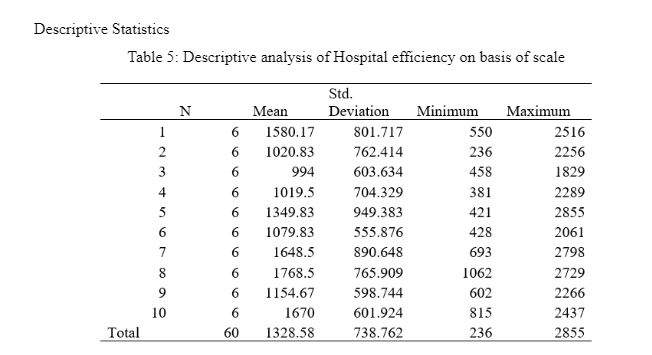
Table 5 represents the descriptive analysis of hospital efficiency based on a scale ranking where 1 is the worst and 10 is the best. Concerning the analysis, the efficiency of the Kuwaiti hospitals is found to be highest on the 8th scale based on the mean value, which is 1768.5, and the standard deviation is computed as 765.90 on the 8th scale, which means that it can increase or decrease by 765.90 units. The weakest efficiency of the hospitals is found to be on the 3rd scale, which had an efficiency of 994. In contrast, the standard deviation is computed as 603.64, illustrating the efficiency dispersion.
Test of Homogeneity of Variances
Table 6: Levene's Test for Hospital Efficiency

Table 6 reflects the measurement of the assumption of homogeneity of variance through Levene's Test concerning the efficiency ranking. The null hypothesis established for the model is that the variance among the scale ratings about the hospital's efficiency is equal. The significance value is computed as 0.724, above the threshold value of 0.05. Therefore, the null hypothesis is accepted where the scale rating of the hospital's efficiency is equal.
One-Way ANOVA

Table 7 refers to the results of one-way ANOVA in which the hospital's efficiency is measured concerning the ranking scale. The null hypothesis of the model is that the mean value of the hospital's efficiency is similar for all the ranking groups. Based on the sig value, it is identified as 0.397, which led to the acceptance of the null hypothesis. Thus, this implies that the mean value of the efficiency of the hospital is the same for all the ranking groups.
Robustness of Equality of Means
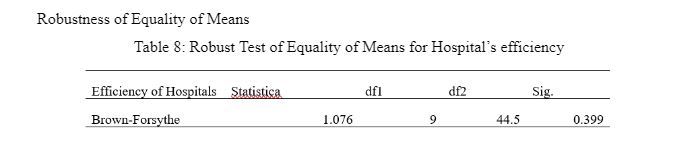
Table 8 reflects the robust test of equality of means for Hospital efficiency in which the sig value is computed as 0.399, which is above the p-value of 0.05. Thus, the null hypothesis is accepted where the means of all the groups are equal.
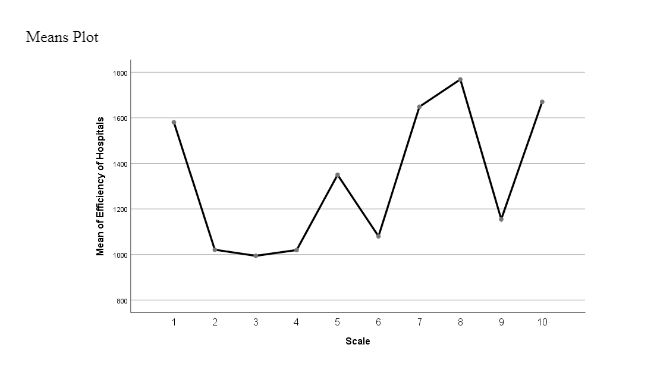
Figure 2: Mean Plots of Efficiency of Hospital
Figure 2 represents the mean plots of the efficiency of hospitals based on the scale in which it is identified that the highest efficiency of hospitals was noted at the 8th ranking. In contrast, the least efficiency among the hospitals was observed on the 3rd scale. Moreover, it is also identified from the above graph that efficiency has significantly declined on the 9th scale of the Kuwaiti hospital.
Evaluation of the Number of Incident Reports and Complaints
Evaluating the number of incident reports and complaints provides crucial insights into the quality of healthcare services. A higher frequency may indicate potential areas for improvement in patient safety and satisfaction, prompting healthcare organizations to address underlying issues and enhance overall performance.
Descriptive Statistics
Table 9: Descriptive Analysis of the Number of Incident Reports and Complaints
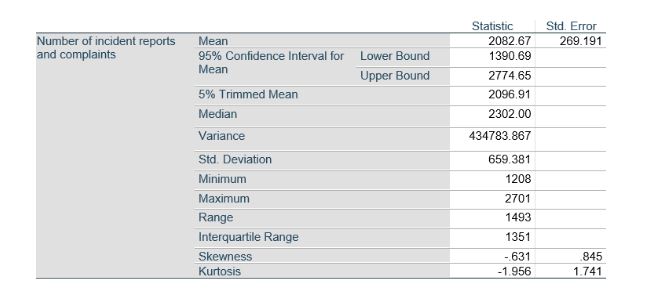
Here, it becomes necessary to mention that 6 hospitals were involved in the survey process. Based on the table mentioned above, it can be observed that the sig value has been computed as 2082.67. This suggests that the average number of incident reports and complaints from the concerned hospitals was 2082.67, provided in a particular time frame. While discussing the median, the median value has been obtained as 2302.00. This suggests that 2302 is the middle number when the data set is sorted and distributed between the two extremes.
Use of Psychodynamic Therapy in Comparison to Medication Help in Treating Depression in Teenagers
Furthermore, in the context of standard deviation, the value has been computed as 659.381. This value suggests that, to this extent, the values deviate from the mean value. Besides this, the minimum value has been identified as 1208 from the data set. This suggests that within the collected responses, the lowest number of reports collected was 1208. However, the highest number of reports collected was 2701. This indicates that 2701 was the highest number of reports collected from the concerned hospitals in a particular period. Further, the obtained skewness value suggests that distribution exhibits to be left-skewed because the negative value has been obtained. Also, the value of Kurtosis indicates that the data is thin-tailed relative to its normal distribution.
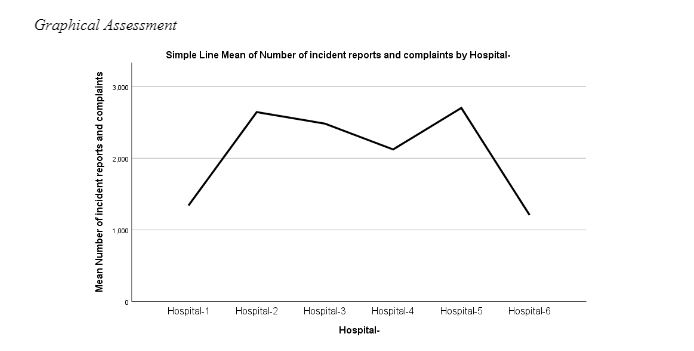
Figure 3 presents the mean plots of hospital incident reports and complaints. Figure 3 outlines the respective means of several incidents and complaints for all six hospitals. As per the results, hospital 2 and hospital 5 are found to have the highest mean number of incident complaints and reports. In contrast, hospitals 1 and 6 were identified with the lowest mean of incidents reported.
Evaluation of Efficiency of Professionals
Evaluating the efficiency of professionals is essential for optimizing workplace productivity and ensuring high-quality outcomes. This assessment involves analyzing workflow effectiveness, time management, and resource utilization to identify areas for improvement and enhance overall organizational efficiency.
Categorized by Hospitals
The section is based on evaluating the efficiency of the professionals in the different government hospitals of Kuwait to evaluate their ability to report medical errors and take a proactive stance in dealing with them.
Descriptive Statistics
Table 9: Descriptive Analysis of Professionals' Efficiency
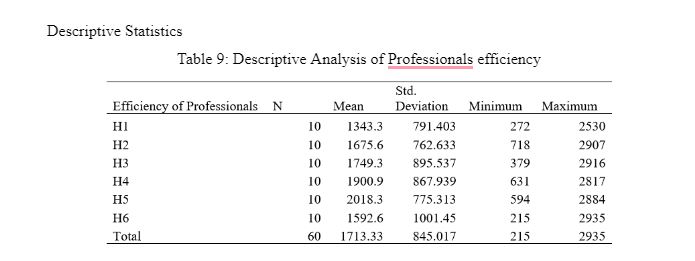
Table 9 reflects the descriptive analysis of the professionals' efficiency based on the six hospitals. While referring to the results, it is found that H5 had the highest level of professional efficiency because its mean value was computed as 2018.3, and its standard deviation was calculated as 775.313. On the other hand, the hospital was found to have the lowest professional efficiency in H1 as its mean value is computed as 1343.3, and the dispersion value is identified as 791.40.
Test of Homogeneity of Variances
Table 10: Levene's Test for Efficiency of Professional
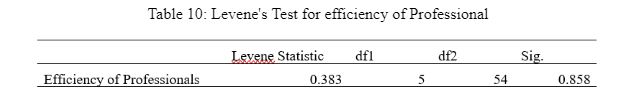
Table 10 reflects Levene's test for evaluating the assumption of homogeneity of variance. The significance value is computed as 0.858, above the p-value of 0.05; therefore, the variance among the different Kuwaiti government hospitals concerning professional efficiency is equal.
One-Way ANOVA
Table 11: One-Way ANOVA for Professional's Efficiency
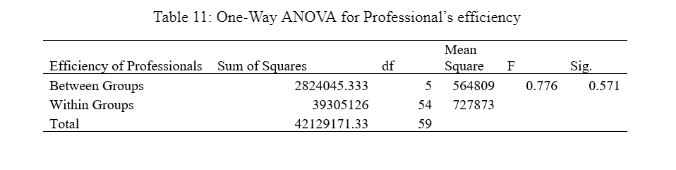
While reflecting on Table 11, its significance value is computed as 0.571, lower than the threshold value of 0.05. Thus, the null hypothesis is accepted in the model where no mean value difference exists in the Professional's efficiency among all the groups.
Robustness of Equality of Means
Table 12: Robust Test of Equality of Means for Professional's Efficiency
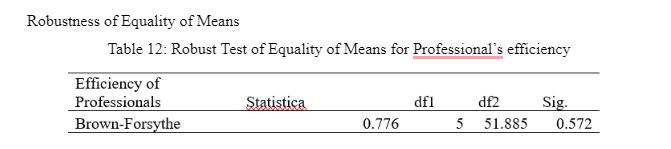
Table 12 reflects the robust test for equality of means regarding professional efficiency based on the six hospitals. The significance value is 0.572, which indicates acceptance of the null hypothesis where the means of all the groups are equal.
Means Plot
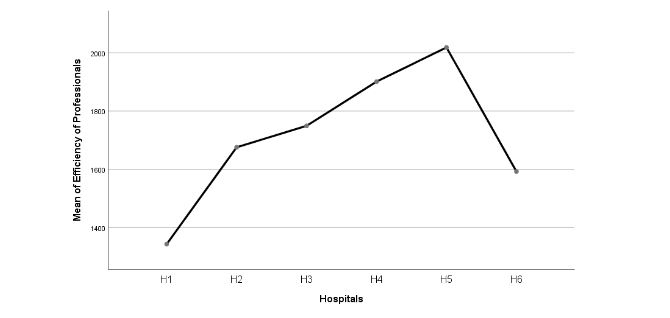
Figure 3: Mean Plots of Efficiency of Professionals
Figure 3 reflects the mean plots of efficiency of professionals in which the government hospital of Kuwaiti found the highest mean plot is H5, followed by H4. On the contrary, the hospital with the lowest efficiency of professionals is H1.
Categorized by Scale
The following section is based on the evaluation of the efficiency of the professional, which is categorized by a ranking scale from 1 to 10, where 1 reflects bad efficiency, and 10 reflects perfect efficiency.
Descriptive Statistics
Table 13: Descriptive Analysis of Professionals' efficiency by scale
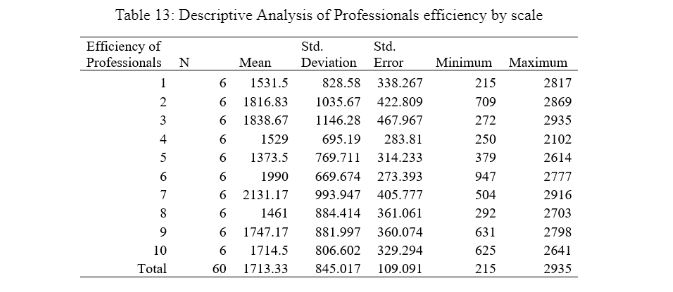
Table 13 reflects the descriptive statistics of professional efficiency based on the scale in which it is determined that the highest level of professional efficiency aspect is observed on the 7th scale, where the mean value is computed as 2131.17. The dispersion value is identified as 993.94. On the other hand, the lowest professional efficiency is observed on the 5th scale, as the mean value is computed as 1373.5 for professional efficiency, whereas the dispersion value is calculated as 314.233.
Test of Homogeneity of Variances
Table 14: Levene's Test for Efficiency of Professional
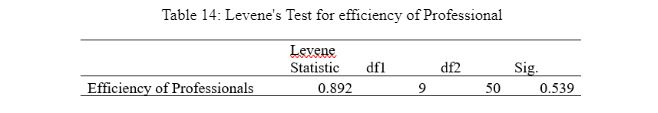
Table 14 reflects Levene’s test, which measures the assumption of homogeneity of variance among the groups. The significance value is computed as 0.539, demonstrating that the variance among the difference scales concerning professional efficiency is equal.
One-Way ANOVA
Table 15: One-Way ANOVA for Professional’s Efficiency
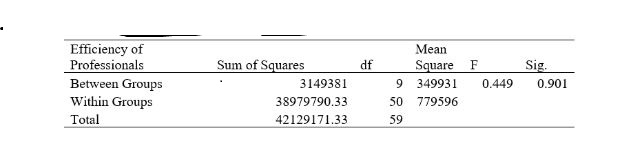
Table 15 refers to the one-way ANOVA test for evaluating the mean value difference among the professional efficiency concerning the different scales. The sig value is 0.901, above 0.05; therefore, the null hypothesis is accepted in which the mean value of professional efficiency concerning all groups is equal.
Robustness of Equality of Means

Table 16 is the robust test of equality in which the Brown-Forsythe test is conducted to evaluate the equality of means for the professional’s efficiency concerning the scale. The significance value is 0.90, above the value of 0.05; hence, the mean of all the groups is equal concerning professional efficiency.
Means Plot
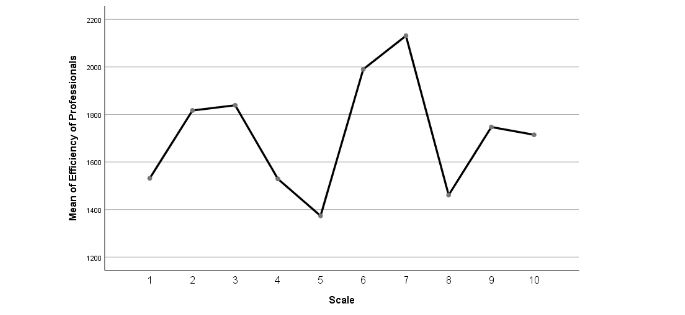
Figure 4: Mean Plots of Efficiency of Professionals
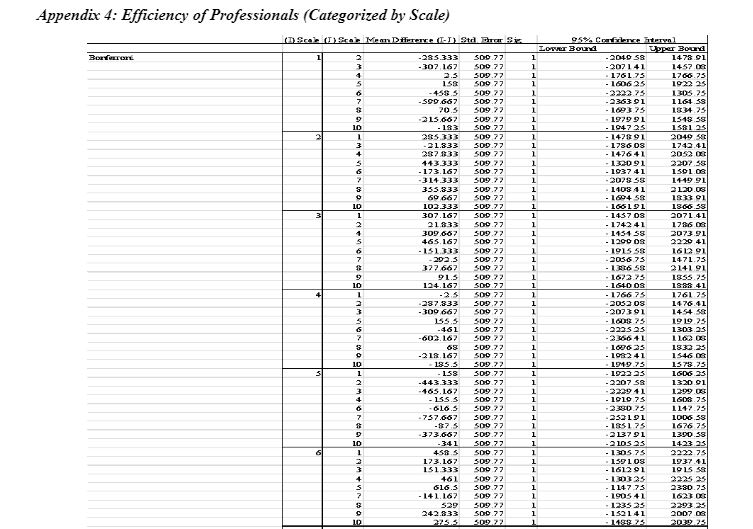
The mean plots of the efficiency of professionals can be observed in Figure four, where the highest efficiency is observed at the 7th scale concerning medical error reporting. On the contrary, the lowest professional efficiency is observed in the fifth scale concerning the mean value.
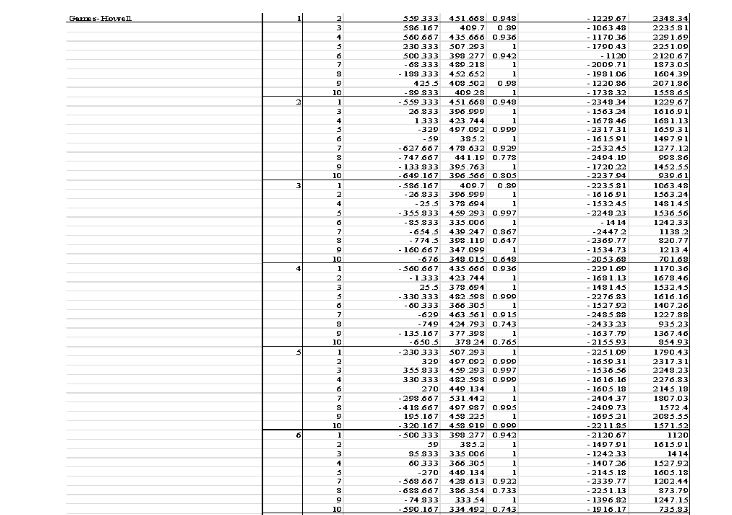
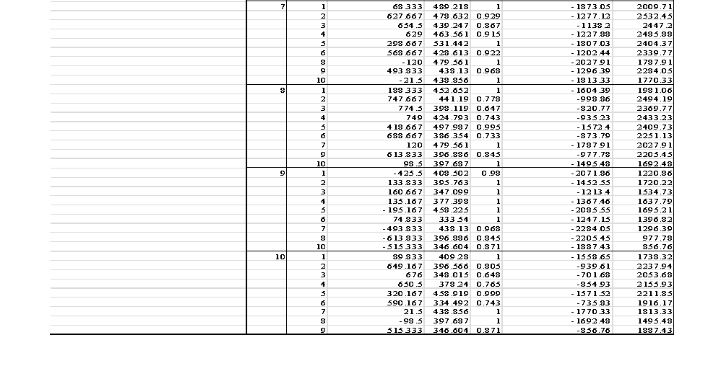
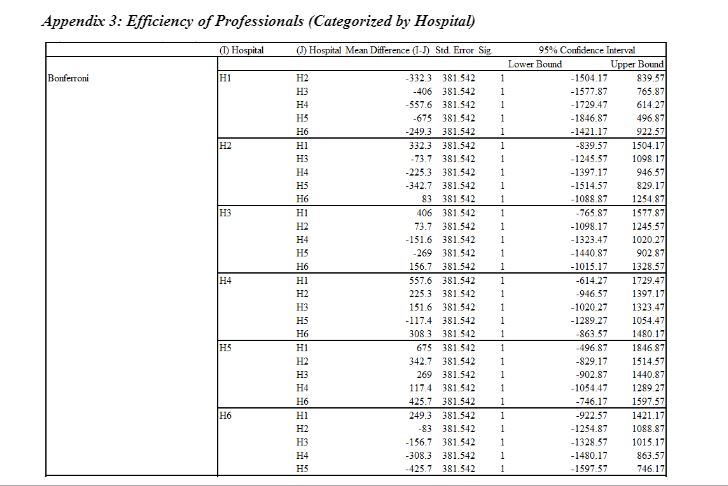
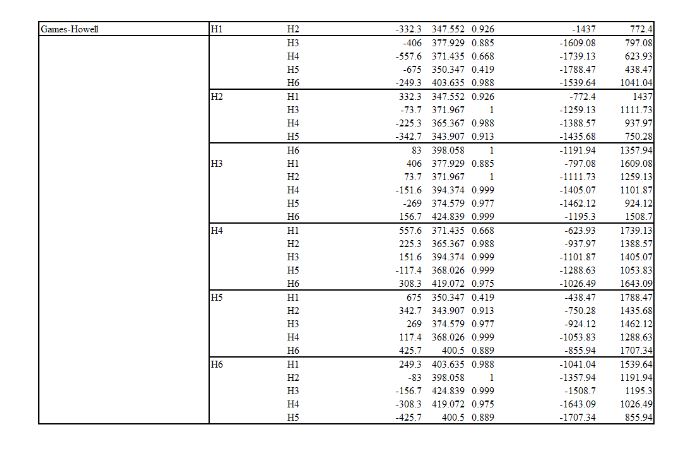
Evaluation of Efficiency of Professionals Concerning Category
In the following section of the report, an evaluation was conducted concerning the categories of professionals working in the hospital. This assessment aims to evaluate whether or not the efficiency level differs among nurses, Dr/physicians, or pharmacists.
Categorized by Hospitals
Specifically, in this section, the six hospitals mentioned earlier have conducted the evaluation.
Descriptive Statistics
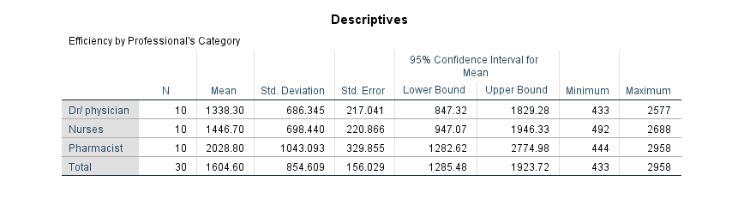
The results of descriptive statistics, including mean, standard deviation, minimum and maximum, have been presented in Table 17. It has been evaluated that the average efficiency of Dr/physicians is computed to be 1,338.3 out of 3,000. In addition, out of 3,000, the average efficiency of the nurses is calculated to be 1,446.7, whilst pharmacists are computed to have 2,028.8.
Similarly, the standard deviation in terms of efficiency scale in Dr/physicians, nurses, and pharmacists is computed to be 686.3, 698.4, and 1043.09, respectively. This depicts that the highest efficiency is recorded in the category of pharmacists. However, the deviation in efficiency level is also high. The table also illustrates maximum and minimum values where it has been found that the minimum efficiency is computed in the category of Dr/physicians. In contrast, the maximum is computed in the category of pharmacists.
Table 17: Descriptive Statistics of Efficiency of Professionals concerning Category Sorted by Hospitals
Test of Homogeneity of Variances
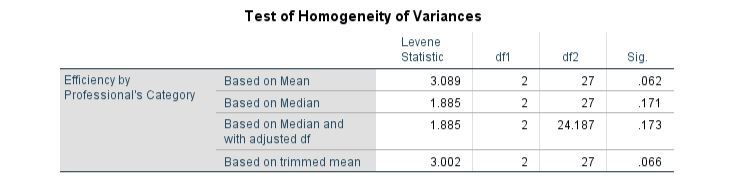
Since it is one of the major assumptions of the one-way ANOVA analysis that the variances should not be heterogeneous, Levene’s test has been employed. The results presented in Table 18 imply that the variances are homogeneous. The assertion was drawn based on the sig value, computed as 0.062> 0.05. Therefore, the null hypothesis entailing the inference that variances are homogenous has been retained.
Table 18: Homogeneity of Variances of Efficiency of Professionals Category sorted by Hospitals
ANOVA Analysis
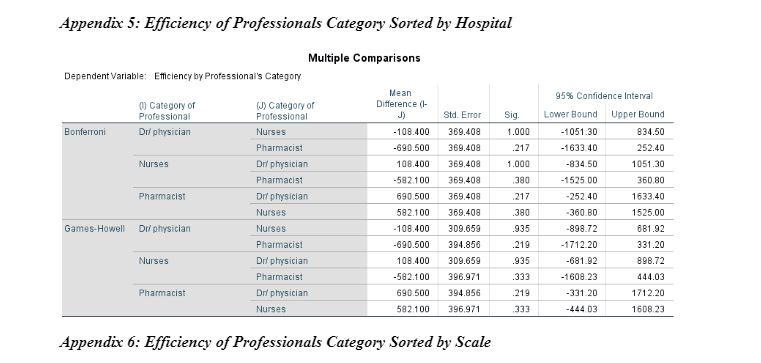
The results have been presented and interpreted in this section to determine the differences among the categories of professionals. The results are illustrated in Table 19, which depicts that the f-statistics are computed to be 2.021 with a p-value of 0.152. Hence, it can be concluded that the efficiency level does not significantly differ among Dr/physicians, nurses, and pharmacists. In this case, the findings are similar to the study conducted by Laurant et al. (2018), who also found similar efficiency levels between them.
Table 19: ANOVA Analysis of Efficiency of Professionals Category sorted by Hospitals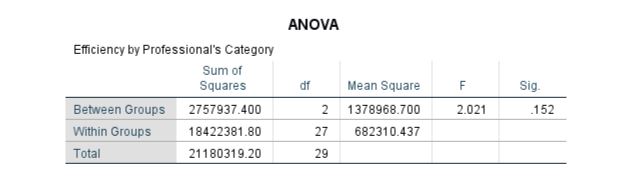
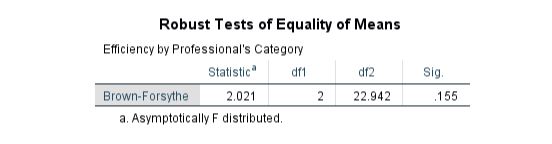
As the results are insignificant, it can be seen that the equality of means is also not robust in terms of the Brown-Forsythe test. The results are depicted in Table 20.
Need Help with Academic Writing? Get a Response within 24 Hours!
Table 20: Robustness of Equality of Means Efficiency of Professionals Category sorted by Hospitals
As the results are insignificant, it can be seen that the equality of means is also not robust in terms of the Brown-Forsythe test. The results are depicted in Table 20.
Table 20: Robustness of Equality of Means Efficiency of Professionals Category sorted by Hospitals
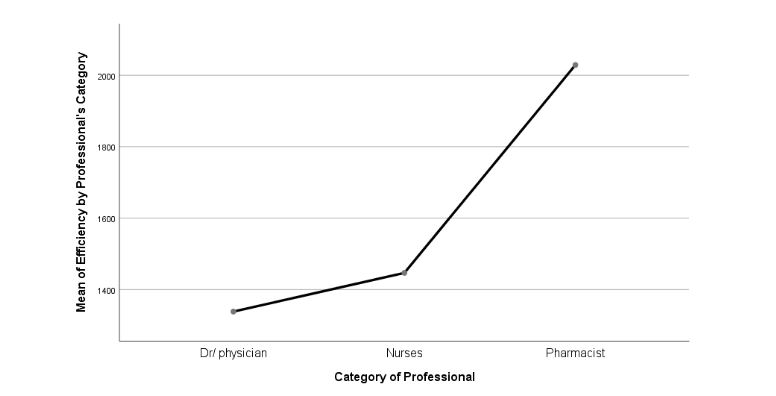
Figure 5: Means Plot Means Plot of Efficiency of Professionals concerning Category sorted by Hospital
Categorized by Scale
The efficiency scale has sorted the data in this specific section. This has helped examine which scale is more common in hospitals regarding efficiency. In addition, it has also assisted in determining the overall efficiency of Dr/physicians, nurses, and pharmacists on the efficiency scale ranging from 1 to 10, implying low efficiency to perfect efficiency.
Descriptive Statistics
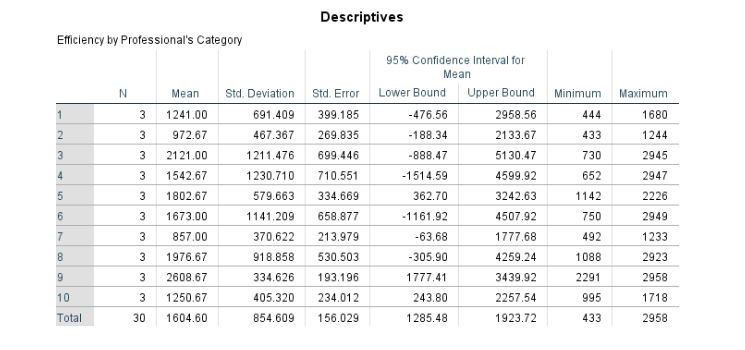
In the context of the data sorted by efficiency scale, the results of the descriptive statistics have been presented in Table 21. It has been found that the most concentrated scale score in six hospitals in the 9th score has an average value, meaning all the professionals have considerably high efficiency. The lowest efficiency concentration is found in the 7th score, with an average of 857. In addition, the minimum deviation amongst the efficiency in professionals is computed as the 9th score attributed to a value of 334.6.
Table 21: Descriptive Statistics of Efficiency by Professionals’ Category sorted by Scale
Test of Homogeneity of Variances
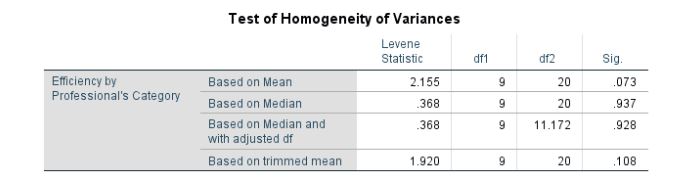
Even in this case, the report incorporates homogeneity testing using Levene’s statistic, computed at 2.155 with a p-value of 0.73. The p-value is above the threshold of 5%. Hence, the null hypothesis is retained, concluding that variances are not heterogeneous. The results are depicted in Table 22.
Table 22: Homogeneity Testing of Efficiency of Professionals concerning Category sorted by Scale
ANOVA Analysis
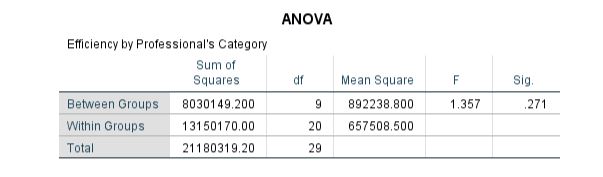
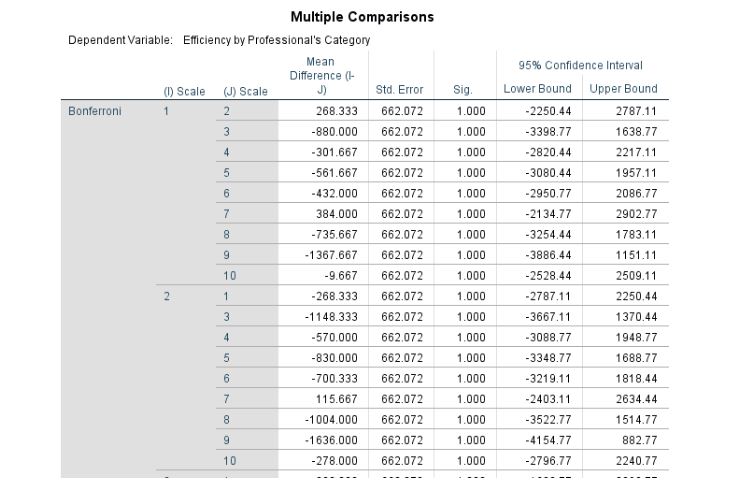
One-way ANOVA concerning scale has been conducted to determine the variation in efficiency scale amongst all the medical professionals. The results are presented in Table 23. The f-statistics has been computed to be 1.357 with a p-value of 0.271 (p-value> 0.05). Hence, the p-value implies no difference in the scale efficiency of the professionals working in different hospitals. However, considering the sensitive nature of the profession, the health service sector and the associated practitioners should be highly efficient (WHO, 2016). The statement implies that the average efficiency of all professionals should be high, and the model score obtained in this case is 9, which is also high. Hence, the findings are consistent.
Table 23: ANOVA Analysis of Efficiency of Professionals concerning Category sorted by Scale
Robustness of Equality of Means
In the same vein, as the ANOVA analysis was insignificant, the Brown-Forsythe test to evaluate the robustness of means equality is also insignificant. The results can be seen in Table 24.
Table 24: Robustness of Equality of Means of Efficiency of Professionals concerning Category sorted by Scale

Means Plot
According to the results of one-way ANOVA, the means plot has been constructed and plotted in Figure 6. It is evident that the variation amongst the scale is present; however, that is statistically insignificant. The means plot also depicts that the highest point is formed at score 9, followed by the 3rd score. However, the lowest concentration is computed to be at the 7th score. Furthermore, the difference is avidly minimal from point 4 to point 6. Provided this, it can also be seen that some concentration at score 1 depicting poor efficiency is also present. On the contrary, a perfect score of 10 is also found to be concentrated; however, it is relatively less than others.
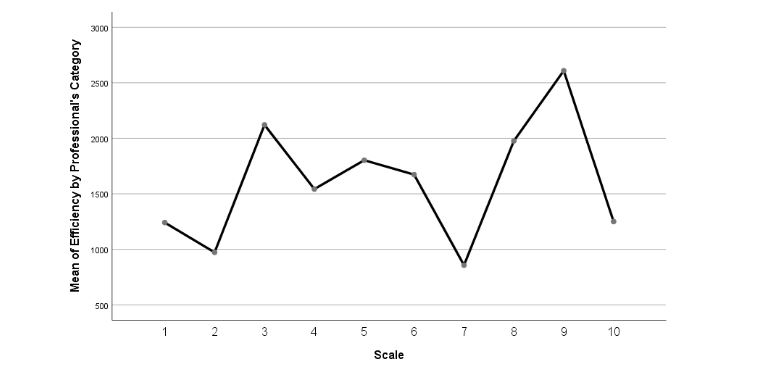
Figure 6: Means Plot of Efficiency of Professionals concerning Category sorted by Scale
Evaluation of the Overall Hypotheses
All the evaluations conducted in the preceding sections of this report are presented in tabular form in this section. The decision of each hypothesis has been taken based on the p-values discussed, interpreted, and evaluated in the preceding sections. In this concern, it has been found that all the hypotheses have been rejected because none of the p-values of the one-way ANOVA table was found to be statistically significant. All the values were above the threshold, which was 5%. The assessment of the hypotheses has been presented in Table 25.
Table 25: Hypotheses Assessment Table
| Hypothesis Number | Statement | Decision |
| H1a | The efficiency of hospitals varies concerning each hospital significantly | Rejected |
| H2a | The efficiency of hospitals varies significantly concerning the efficiency scale. | Rejected |
| H3a | The efficiency of professionals varies in each hospital significantly | Rejected |
| H4a | The efficiency of professionals varies significantly concerning the efficiency scale. | Rejected |
| H5a | The efficiency of professionals working in hospitals varies significantly depending on their category. | Rejected |
| H6a | The efficiency of professionals working in hospitals varies significantly concerning the efficiency scale. | Rejected |
Summary of the Results
The overall analysis of the results provides conclusive findings of each variable of this study. Firstly, concerning the efficiency of each hospital studied in this research, H1 has the highest efficiency level compared with other hospitals. In this context, as per the results of Homogeneity of Variances, the significance value is figured ass 0.919. Based on this, the null hypothesis of this study has been accepted. Similarly, the results of ANOVA also validate these findings.
On the other hand, the efficiency of hospitals based on scale ranking is highest on the 8th scale, whereas the weakest efficiency of Kuwaiti hospitals is found to be on the 3rd scale. Moreover, as per the results of ANOVA, the mean value of hospitals' efficiency is similar for all ranking groups. Concerning the number of incident reports and complaints, petals 5 and 2 were found to have the highest mean number of reported incidents.
Regarding the efficiency of professionals amongst all the investigated hospitals, H5 is found to have the highest professional efficiency, whereas H1 has the lowest professional efficiency. The results of professional efficiency based on scale category identify the 7th scale with the highest efficiency of professionals. Lastly, as per the results, the professional category of pharmacists was recorded at the highest efficiency, whereas the DR/Physicians category of professionals was found to be the least efficient. Conclusively, the overall findings of this study have rejected all the hypotheses and accepted the null hypothesis.
Review the Following:
References
Amrhein, V., Trafimow, D. and Greenland, S., 2019. Inferential statistics as descriptive statistics: There is no replication crisis if we don’t expect replication. The American Statistician, 73(sup1), pp.262-270.
Cole, A.P. and Trinh, Q.D., 2017. Secondary data analysis: techniques for comparing interventions and their limitations. Current opinion in urology, 27(4), pp.354-359.
Jayalath, K.P., Ng, H.K.T., Manage, A.B. and Riggs, K.E., 2017. Improved tests for homogeneity of variances. Communications in Statistics-Simulation and Computation, 46(9), pp.7423-7446.
KARAGÖ, D. and Saraçbasi, T., 2016. Robust Brown-Forsythe and robust modified Brown-Forsythe ANOVA tests under heteroscedasticity for contaminated Weibull distribution. Revista Colombiana de Estadística, 39(1), pp.17-32.
Kumar, R., 2019. Research methodology: A step-by-step guide for beginners. Sage Publications Limited.
Laurant, M., van der Biezen, M., Wijers, N., Watananirun, K., Kontopantelis, E. and van Vught, A.J., 2018. Nurses are substitutes for doctors in primary care. Cochrane Database of Systematic Reviews, (7).
World Health Organization, 2016. Health system efficiency: how to make measurement matter for policy and management. World Health Organization. Regional Office for Europe.
Appendices


Get 3+ Free Dissertation Topics within 24 hours?