
Impact of Income Tax Rate on Stock Return
March 15, 2022
She Clicks – Digital Literacy Program
May 26, 2022
 Download PDF File
Introduction
In the last general election in 2019, a majority of the people in the United Kingdom – 67.3 per cent – turned out to vote (UK Political Info, 2020). This is an increase from the general elections of 2005 and 2010. Survey results from 2012 indicate that seven out of ten Britons (about 72 per cent) identified with a specific political party (Lee and Young, 2018). It seems that a majority of the British public is truly interested in politics and engaging with their democratic system. Political scientists often argue that an individual’s political interest is usually stable over the course of their lifetime. The current report uses longitudinal data from the UK’s Understanding Society to address the question;
Does average political interest change at different points of an electoral cycle?
The report analyses if there is any evidence of stability over electoral cycles 2010 and 2015. The data of political interest is examined for the period of time of 2009 to 2016 against the age of the participants. In essence, the report aims to empirically answer the question by understanding this phenomenon against age and post-electoral cycles.
The report attempts to answer this question using R-Studio to accumulate, organise, and, analyse the UK’s Understanding Society data on political interest. The specific set of data that is used for attempting to answer the question is vote6 (a_indresp) with the main survey question being:
How interested would you say you are in politics? Would you say you are…?
The participants of the survey were provided with options of 1- very, 2-fairly, 3- Not very, and 4- Not at all interested.
Voter interest was then analysed for each wave or year with the current report focusing on the general election cycle of 2010 and 2015. However, the vote6 dataset was also analysed for the years 2010, 2011, 2015, and 2016. The results of the report will interpret that data while also providing some possible political commentary of the possibility of the results.
Literature Review
It is obvious from the vast political spectrums throughout the world that some people are more interested in politics than their contemporaries (Prior, 2010). Why this may be is an important unanswered question for many political scientists and political sociologists as political interest is considered to be a robust predictor for political behaviours that make democracy work. According to Walther and Hellstrom (2016), politically interested people are more knowledgeable about the politics that affects them and are more likely to vote or participate in politics in other ways.
Studies such as Stromback and Johansson (2007) have found that people are more likely to be mobilised by-elections and that level of political interest varies throughout the electoral cycle. Stromback and Johansson (2007) hypothesised that people express higher levels of political interest during election years than compared to non-election years. The study uses the normative point of view to suggest that people that express high levels of political interest are those that are more likely to vote than their counterparts that express low levels of political interest (Stromback & Johansson, 2007).
A study conducted by Prior (2010) compared political interest longitudinally among voters in the United States, United Kingdom, and Germany. The study concluded, that with the exception of Germany during the period of reunification, there is high absolute stability in political interest from year to year over a long period of time (Prior, 2010). Prior (2010) concludes that political interest is a robust predictor for political involvement and remains fairly stable over long periods of time which may aid in providing an explanation to why political behaviours take place in constant regularity. Lau, Kleinberg, and Ditonto (2018) assert that individuals have the habit of either going to the polls regularly or abstaining from voting regularly. Arzheimer and Schoen (2016) argue that this may be caused by a habit of voting which is akin to habitual stable interest in politics.
Similarly, a study conducted by Archeimer and Schoen (2016) using data from a 1997-2000 BES panel survey found that Britain’s traditional model is adaptive enough to describe the role of interest in politics in impacting the prevalence and stability of party attachments. The results found that England, Scotland, and Wales support the classic view that a change in party identification is a very rare event for both groups of citizens – high-interest and low-interest (Archeimer and Schoen, 2016). The study further argues party identification is a motivating reason for political interest and also results in more stability of interest in politics overtime, but these sentiments that allow for stability are associated with citizens that show high-interest in politics (Archeimer and Schoen, 2016).
1 Statistical Interpretation
The statistical analysis of the UK’s Understanding Society was conducted using R-studio. The complete procedures in terms of coding can be found in the attached file for submission. To conduct the analysis, the following packages for R were used:
- ‘ggplot’
- ‘tibble
- ‘tidyr’
- ‘purr’
- ‘dplyr’
- ‘forcats’
The data was reshaped, filtered and recoded to take into account age and gender of participants. The data was then used to calculate mean political interest based on gender and wave (i.e. wave_1, wave_2, wave_6, and wave_7). The data was used to estimate political interest by using delta_mean. A larger delta mean was hypothesised to mean unstable political interest while a delta of zero was hypothesised to mean a constant level of political interest. Aside from the delta_mean, the data were analysed for inferential statistics.
The first wave to be analysed was the UK’s electoral cycle of 2010. For this purpose, wave_1 was used which presented data on political interest from 2009 to 2010. R-studio produced an output that is illustrated in figure 1. Firstly, the frequency of the data was analysed, in which it was found that 31.11 per cent of the participants were “fairly” interested in politics during this 2010 electoral cycle.
Only, 9.57 per cent of the total participants indicated that they were “very” interested in politics, while 27.49 per cent indicated they were “not very” interested in politics, and 25.04 per cent indicated that they were “not interested in politics” at all. The frequency of responses was further analysed based on gender. It was found that for wave_1, 62.5 per cent of males indicated in the survey that they were “very” interested in politics, then compared to 37.5 per cent of females that indicated they were “very” interested in politics. Amongst wave1 participants, 49.1 per cent of males indicated they were “fairly” interested in politics, while 50.9 per cent of females indicated they were “fairly” interested in politics. Within the dataset of wave1 60.5 per cent of females indicated that they were “not very” interested in politics, while only 39.5 per cent of males made such an indication. Lastly, 64.4 per cent of females indicated that they are “not at all interested” in politics compared to 35.6 per cent of males that similarly selected this option.
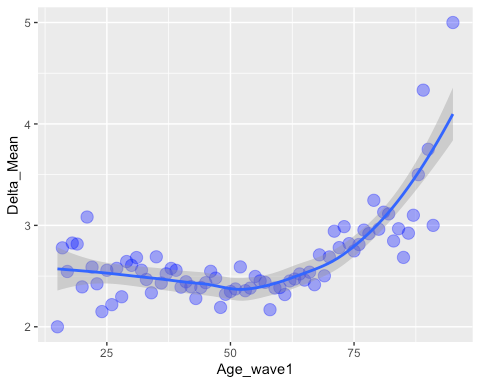
When analysing the data in R-studio it is found that 4.7 per cent of participants below 20 years of age were “very” interested in politics, while 5.2 per cent were “fairly” interested, 7.4 per cent “not very interested”, and 12.5 per cent “not at all interested” in politics. Individuals between the ages of 21 to 30 were mostly “not at all interested” in politics as indicated by 20.6 per cent of the participants’ survey results from wave1. From this age group, only 13 per cent indicated that they were “very” interested in politics. Similarly, individuals aged 31 to 40 years indicated they were “not at all interested” in politics based on the survey frequency of 20 per cent. The trend of greater interest is found in individuals aged 50 years and older, with a frequency showing 47.4 per cent “very” interested in politics, 44.2 per cent of individuals in this age group indicated they are “fairly” interested in politics, and only 29.1 per cent indicating they are “not at all interested” in politics. Based on the age of individuals the delta mean is greater than zero as illustrated in figure 1, therefore it is concluded that political interest is unstable throughout the age groups of wave 1.
The next wave (i.e. wave_2) includes data on political interest between the years 2010 and 2011. Inferential statistics that examined the frequency of the data finds that 9.26 per cent of participants in wave 2 indicated they were “very” interested in politics. In the same dataset, it is found that 31.84 per cent of participants indicated political interest as being “fairly”. Lastly, 26.39 per cent of participants in wave_2 indicated they were “not very” politically interested, while 25.2 per cent indicated that they were “not at all interested” in politics.
The data was further analysed based on gender for political interest for wave_2. It was found that 62.5 per cent were found to be “very” interested in politics while 37.5 per cent of females indicated as such. Furthermore, 51.1 per cent of females indicated that they were “fairly” interested in politics, while 48.9 per cent of their male counters also indicated as such. Nonetheless, 60 per cent of females in the wave_2 indicated that they were “not very” interested in politics, while male contemporaries indicated such by 40 per cent. Lastly, wave_2 shows that 64.3 per cent of females are “not at all interested” in politics, while only 35.7 per cent of males indicated this.
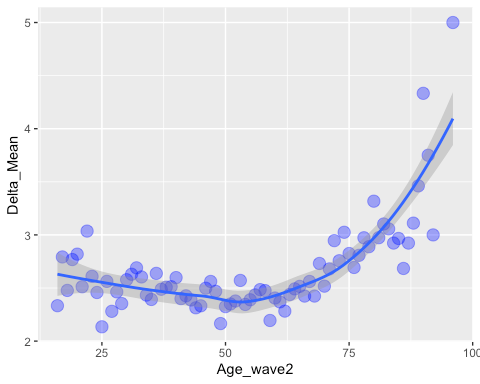
Figure 2- Delta Mean of Political Interest based on Age for 2010-2011
Wave 2 data on political interest was further analysed to explain the trend of political interest across age groups of the participants. The delta mean of this was calculated in R-studio and illustrated in figure 2. As seen in figure 2 the mean political interest represented in delta_mean was compared to the age_wave 2. To better understand the delta mean it is essential to comprehend the inferential statistics associated with age and political interest.
For examination, 5.9 per cent of participants less than 20 years indicated they are “very” interested in politics, in this same way, participants between 21 and 30 years, about 6.8 per cent indicated that they are “very” interested in politics. The group with the most interest or “very” interest in politics was individuals over the age of 50, as indicated by 11.6 per cent. The group with the greatest percentage of frequency of being “fairly” interested in politics was individuals over the age of 50, as indicated with 36.9 per cent frequency.
Furthermore, 32 per cent of individuals in the group aged 41 to 50 also indicated that they were “fairly” interested in politics. What is interesting to note in this data of wave_2 is that both age groups 31 to 40 years and 41 to 50 years indicated by 27.3 per cent, respectively, that they are “not very” interested in politics. Lastly, the age group that showed the most disinterest in politics between the years 2010 and 2011 were 38.2 per cent of individuals below the age of 20. Within the same category of disinterest (i.e. “not at all interested” in politics) 19.5 per cent of individuals over the age of 50 shared such sentiment. Based on age of individuals the delta mean is greater than zero as illustrated in figure 2, therefore it is concluded that political interest is unstable throughout the age groups of wave 2.
The next relevant election cycle studied for political interest was the 2015 general election in the UK. For this analysis, the dataset of wave_6 from the UK’s Understanding Society was used. The results of the electoral cycle for delta mean is illustrated in figure 3. When analysing the data for descriptive statistics, gender against political interest was examined. It was found that in wave_6, 62.7 per cent of males were “very” interested in politics versus 37.3 per cent of females that indicated so for this option.
When analysing the gender trends for “fairly” interested in politics 50.1 per cent indicated as such, while 49.8 per cent of females indicated so. When comprehending the extent of disinterest in politics, it is found in the wave_6 datasets that 59.8 per cent of females indicated they are “not very” interested in politics, while 40.2 per cent of males indicated this. Also, 65.0 per cent of females indicated they are “not at all interested” in politics, while 35.0 per cent of males indicated this disinterest.
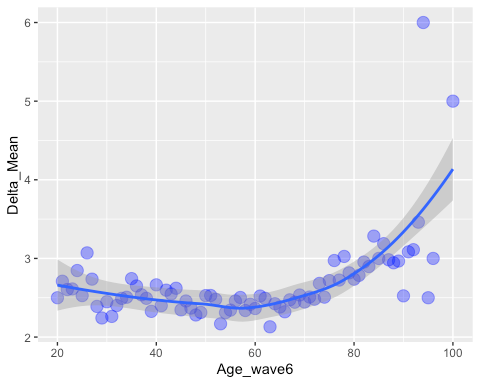
Figure 3- Delta Mean of Political Interest based on Age for 2014-2015, 2015 Electoral Cycle UK
When examining the level of political interest against age it was found that 58.0 per cent of individuals over the age of 50 were “very” interested in politics, while only 5.0 per cent of individuals less than 20 years were “very” interested in politics. Wave 6 datasets also indicate that 51.5 per cent of individuals over the age of 50 were “fairly” interested in politics, while 5.1 per cent of individuals less than 20 years of age were “fairly” interested in politics. This trend is also seen in the disinterest of politics.
According to wave6 data, 46.5 per cent of participants over the age of 50 indicated they are “not very” interested in politics. In the say way 7.3 per cent of individuals, less than 20 years indicated they are “not very” interested in politics. Lastly, 36.6 per cent of individuals over the age of 50 indicated that they are “not at all interested” in politics. In the same way, 11.0 per cent of individuals less than 20 years of age indicated they are “not at all interested” in politics. This disinterest amongst age groups is seen in groups of age between 21 and 30 years with 16.8 per cent indicating no interest at all in politics, and 16.2 per cent of ages 31 to 40 years indicating no interest in politics. Based on the age of individuals the delta mean is greater than zero as illustrated in figure 3, therefore it is concluded that political interest is unstable throughout the age groups of wave 6.
After the electoral cycle of 2015, dataset wave_7 was examined for the years 2015 to 2016. The accumulative frequency of the wave_7 dataset found that 10.6 per cent of participants indicated that they are “very” interested in politics. In the same dataset, it is found that 32.64 per cent of individuals are “fairly” interested in politics. In terms of disinterest, it is found that 26.99 per cent of participants between the years of 2015 to 2016 were “not very” interested in politics. Lastly, wave_7 data indicate that 22.49 per cent of individuals were “not at all interested” in politics.
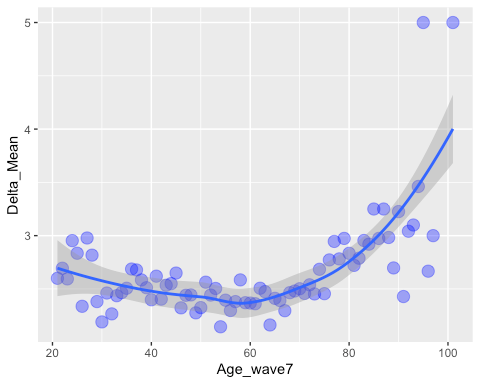
Figure 4- Delta Mean of Political Interest based on Age for 2015-2016
When analysing the data based on gender it is found that 60.7 per cent of males were “very” interested in politics. While, 39.3 per cent of females in the wave 7 dataset showed they were “very” interested in politics. Within the data it is found that 50.6 per cent of females show a “fair” amount of interest in politics, while 49.4 per cent of males indicated as such. On the level of disinterest, it was found that 59.9 per cent of females were “not very” interested in politics, while 40.1 per cent of males indicated this disinterest. In the same way, 65.1 per cent of females indicated “not at all interested” in politics, while 34.9 per cent of males indicated this disinterest in politics.
Based on the age of individuals the delta mean is greater than zero as illustrated in figure 4, therefore it is concluded that political interest is unstable throughout the age groups of wave 7. This instability in political interest is evident in descriptive statistical analysis of the data based on age. In the age group of over 50, it is found that 12.9 per cent of the individuals are “very” interested in politics, while 9.2 per cent and 9.6 per cent indicated they were “very” interested in politics for the age groups of 31 to 40 years and 41 to 50 years respectively.
Those individuals less than 20 years, 7.1 per cent, indicate this high level of interest in politics. Lastly, 21 to 30 years of age indicated 7.8 per cent of being “very” interested in politics. In terms of a fair amount of interest in politics, once again, the age group of over 50 had the most interest with a 36.5 per cent indication. For the age group of 41 to 50, it was found that 33.2 per cent were “fairly” interested in politics, while 31.4 per cent of individuals in groups 31 to 40 indicated a fair interest in politics. Individuals less than 20 years indicated 24.2 per cent of fair interest in politics. Disinterest in politics was found the greatest in the age group of 31 to 40, in which 28.3 per cent indicated they were “not very” interested in politics. The age group of fewer than 20 years indicated by a frequency of 32.6 per cent that they were “not at all interested” in politics. This age group should have the most disinterest in politics. While 18.0 per cent of individuals in the age group over 50 indicated that they were “not at all interested” in politics.


Conclusion
From the analysis, it is concluded that political interest is unstable when compared against age groups of 4 waves of UK’s Understanding Society datasets. Across age groups, it is found that those above the age of 50 always should have greater political interest regardless of electoral cycles. The trend of political disinterest is found most among the age group of fewer than 20 years of age. This age group always indicated in each wave that they were not at all interested in politics. Gender was another aspect that should variation in political interest. For example, in each wave, it was found that males also indicated “very” interested in politics compared to their female counterparts. In the same way, females of each wave indicated that they were “not at all interested” in politics.


References
Aniza, S. A. (2011). Election timing and the electoral influence of interest groups. The Journal of Politics, 73 (2), pp. 412-427.
Arzheimer, K., and Schoen, H. (2016). Political interest furthers partisanship in England, Scotland, and Wales. Journal of Elections, Public Opinion and Parties, 26(3), pp. 373-389.
Lau, R. R., Kleinberg, M. S., and Ditonto, T. M. (2018). Measuring voter decision strategies in political behaviour and public opinion research. Public Opinion Quarterly, 82, pp. 911-936.
Prior, M. (2010). You’ve either got it or you don’t? The stability of political interest over the life cycle. The Journal of Politics, 72(3), pp. 747-766.
Stromback, J., and Johanssan, B. (2007). Electoral cycles and the mobilising effects of elections: A longitudinal study of Swedish case. Journal of Elections, Public Opinion, and Parties, 17(1), pp. 79-99.
Walter, D., and Hellstrom, J. (2019). The verdict in the polls: How government stability is affected by popular support. West European Politics, 42(3), pp. 593-617.
Get 3+ Free Dissertation Topics within 24 hours?