


How to Choose a Thesis Topic in Australia (Without Regretting It Six Months Later)
July 15, 2026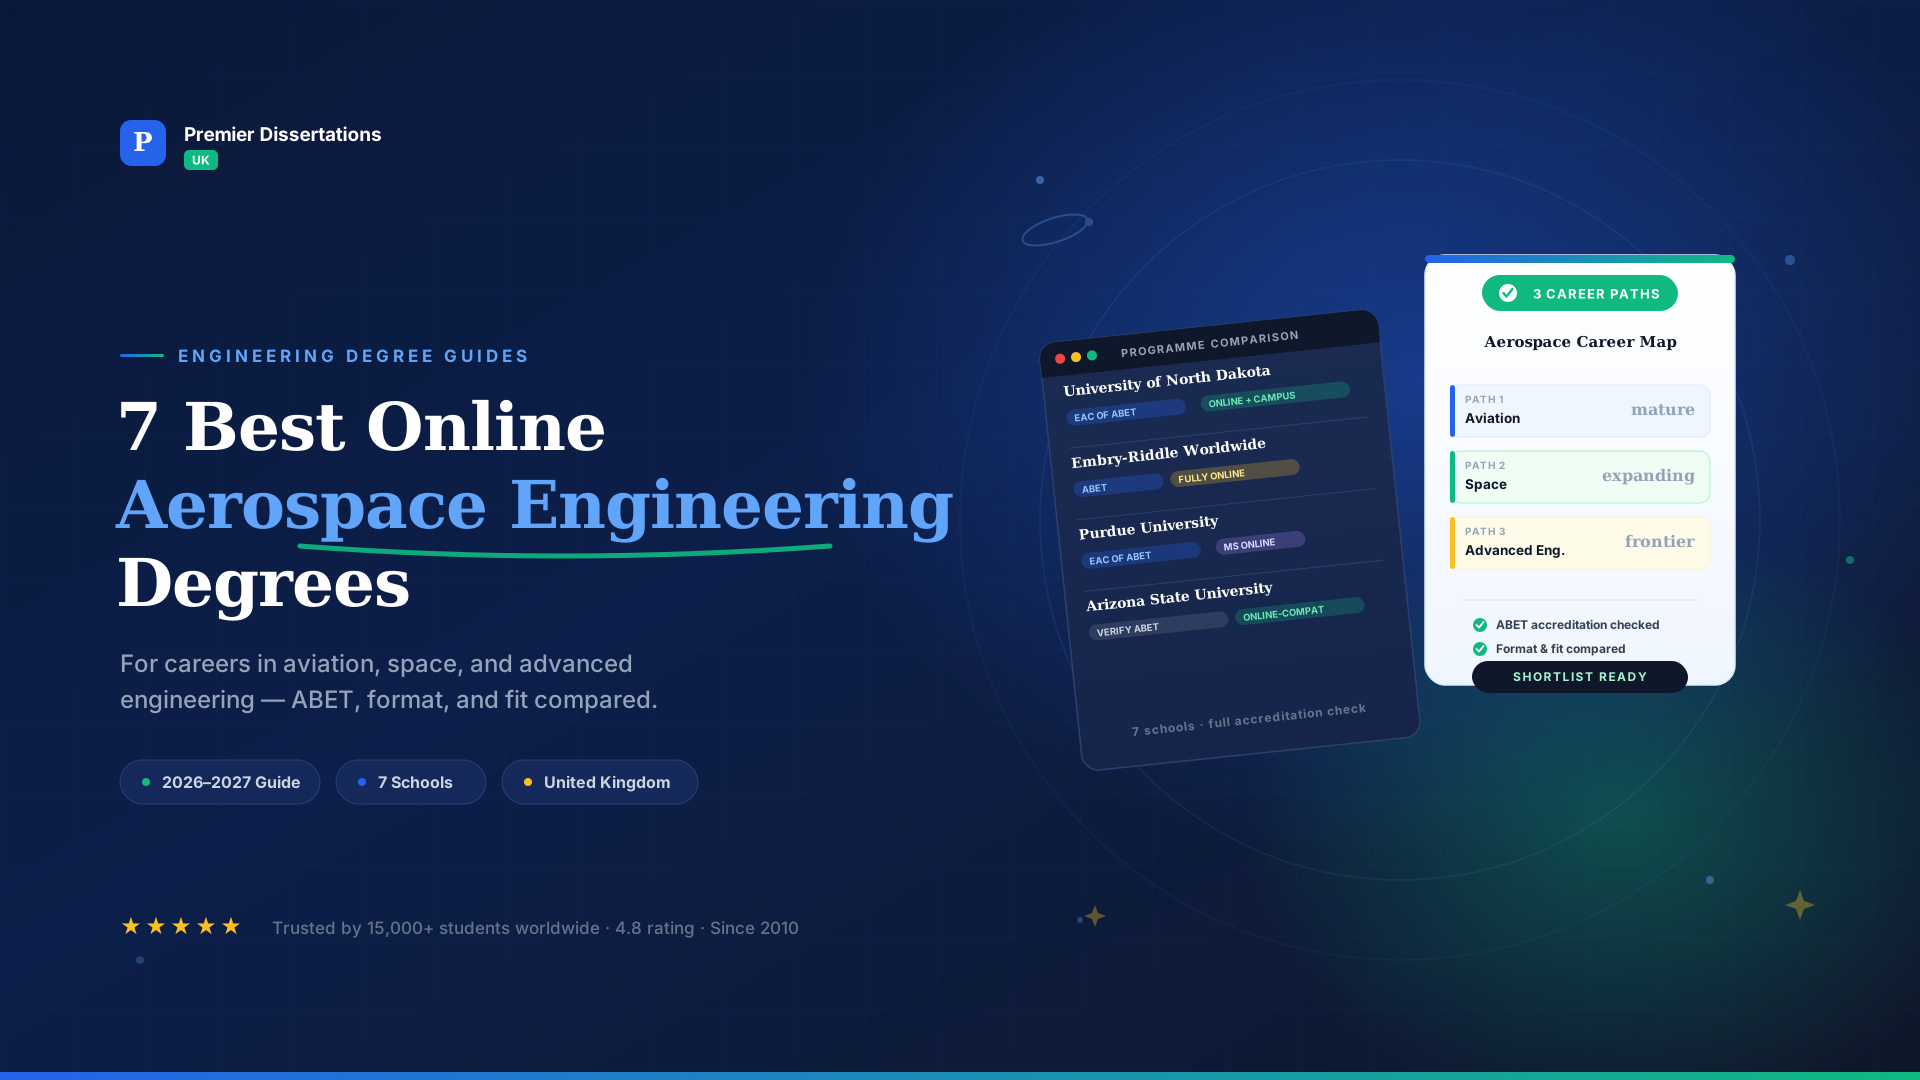
7 Best Online Aerospace Engineering Degrees for Careers in Aviation, Space, and Advanced Engineering
July 21, 2026
Thesis Writing Guides Australia
Updated for 2026 · 13 min read
SPSS is the most common statistics software in Australian thesis research, and also the most misused. Students open it for the first time, click through menus without understanding what they're producing, and end up with a results chapter full of output tables they can't defend when the examiner asks a follow-up question.
This tutorial takes you from a blank dataset to a properly reported result. It's not comprehensive — SPSS can do hundreds of things — but it covers the eighty percent of analyses that show up in Honours, Masters and PhD theses across psychology, education, nursing, business and health sciences.
We'll walk through data setup, the four analyses you'll almost certainly need (descriptives, t-tests, ANOVA, regression), and how to write the results up in APA 7 style so your Chapter 4 doesn't just paste in screenshots.
Want your SPSS analysis run and reported by a statistician? Premier Dissertations AU offers full SPSS data analysis with a written results chapter, APA-formatted tables, and assumption testing documented — from AUD $150 per package. Get a free quote →
Before you open SPSS: three things to have ready
Most SPSS failures happen before the software is even launched. Get these three things settled first:
- Your research questions written down. Every analysis you run should map to one of your questions. If you can't say which question a test answers, don't run it.
- A codebook for your variables. One document listing every variable, its name, its type (nominal, ordinal, scale), and its permitted values. Without this, your dataset becomes unusable within a fortnight.
- Access to SPSS via your university. All Go8 universities and most others provide SPSS free through the student portal. Never pay for a personal licence for thesis work — check with your library first.
The two views that matter
SPSS has two main windows you'll switch between constantly:
Data View
Looks like a spreadsheet. One row per participant, one column per variable. This is where your raw data lives.
Variable View
Where you define what each column actually means — its name, type, label, value codes, and measurement level. This is the view most beginners neglect, and it's the one examiners notice when you don't set it up properly.
Step 1: Setting up your data properly
In Variable View, every variable needs five things filled in correctly:
- Name: Short, no spaces (e.g., gad_total, not GAD-7 Total Score).
- Type: Numeric for numbers, String for text. Almost always Numeric.
- Label: The full human-readable version — this is what SPSS prints in output tables.
- Values: Your coding scheme, e.g., 1 = Male, 2 = Female, 3 = Non-binary.
- Measure: Scale (continuous), Ordinal (ranked), or Nominal (categorical). Getting this wrong makes SPSS refuse the analysis you want.
Watch out for missing data: code missing values consistently (999 is common) and declare them in the "Missing" column of Variable View. If you leave blanks, SPSS treats them differently across tests and your sample size will shift from analysis to analysis.
Step 2: Descriptive statistics — always run these first
Before any inferential test, describe your sample. Every Chapter 4 opens with descriptives.
Menu path: Analyze → Descriptive Statistics → Frequencies (for categorical variables like gender) or Descriptives (for continuous variables like age or scale scores).
What to report in your thesis:
- For continuous variables: mean (M), standard deviation (SD), range, and sample size (n).
- For categorical variables: counts and percentages.
- Always check: skewness and kurtosis (values between −1 and +1 indicate reasonable normality).
APA 7 reporting example
"The sample comprised 148 undergraduate students (72.3% female, n = 107) with a mean age of 21.4 years (SD = 3.2, range = 18–34). Anxiety scores on the GAD-7 ranged from 0 to 19 (M = 8.2, SD = 4.1)."
Step 3: Comparing two groups — the independent samples t-test
Use when you're comparing the means of one continuous variable across two independent groups (e.g., anxiety scores in a treatment vs control condition).
Menu path: Analyze → Compare Means → Independent-Samples T Test. Move your continuous variable into "Test Variable(s)" and your grouping variable into "Grouping Variable", then click "Define Groups" and enter the two codes you're comparing.
Assumptions to check first:
- Normality: Shapiro-Wilk test or a Q-Q plot. Report and document.
- Equality of variances: SPSS gives you Levene's Test automatically in the output. If p < .05, read the "Equal variances not assumed" row.
APA 7 reporting example
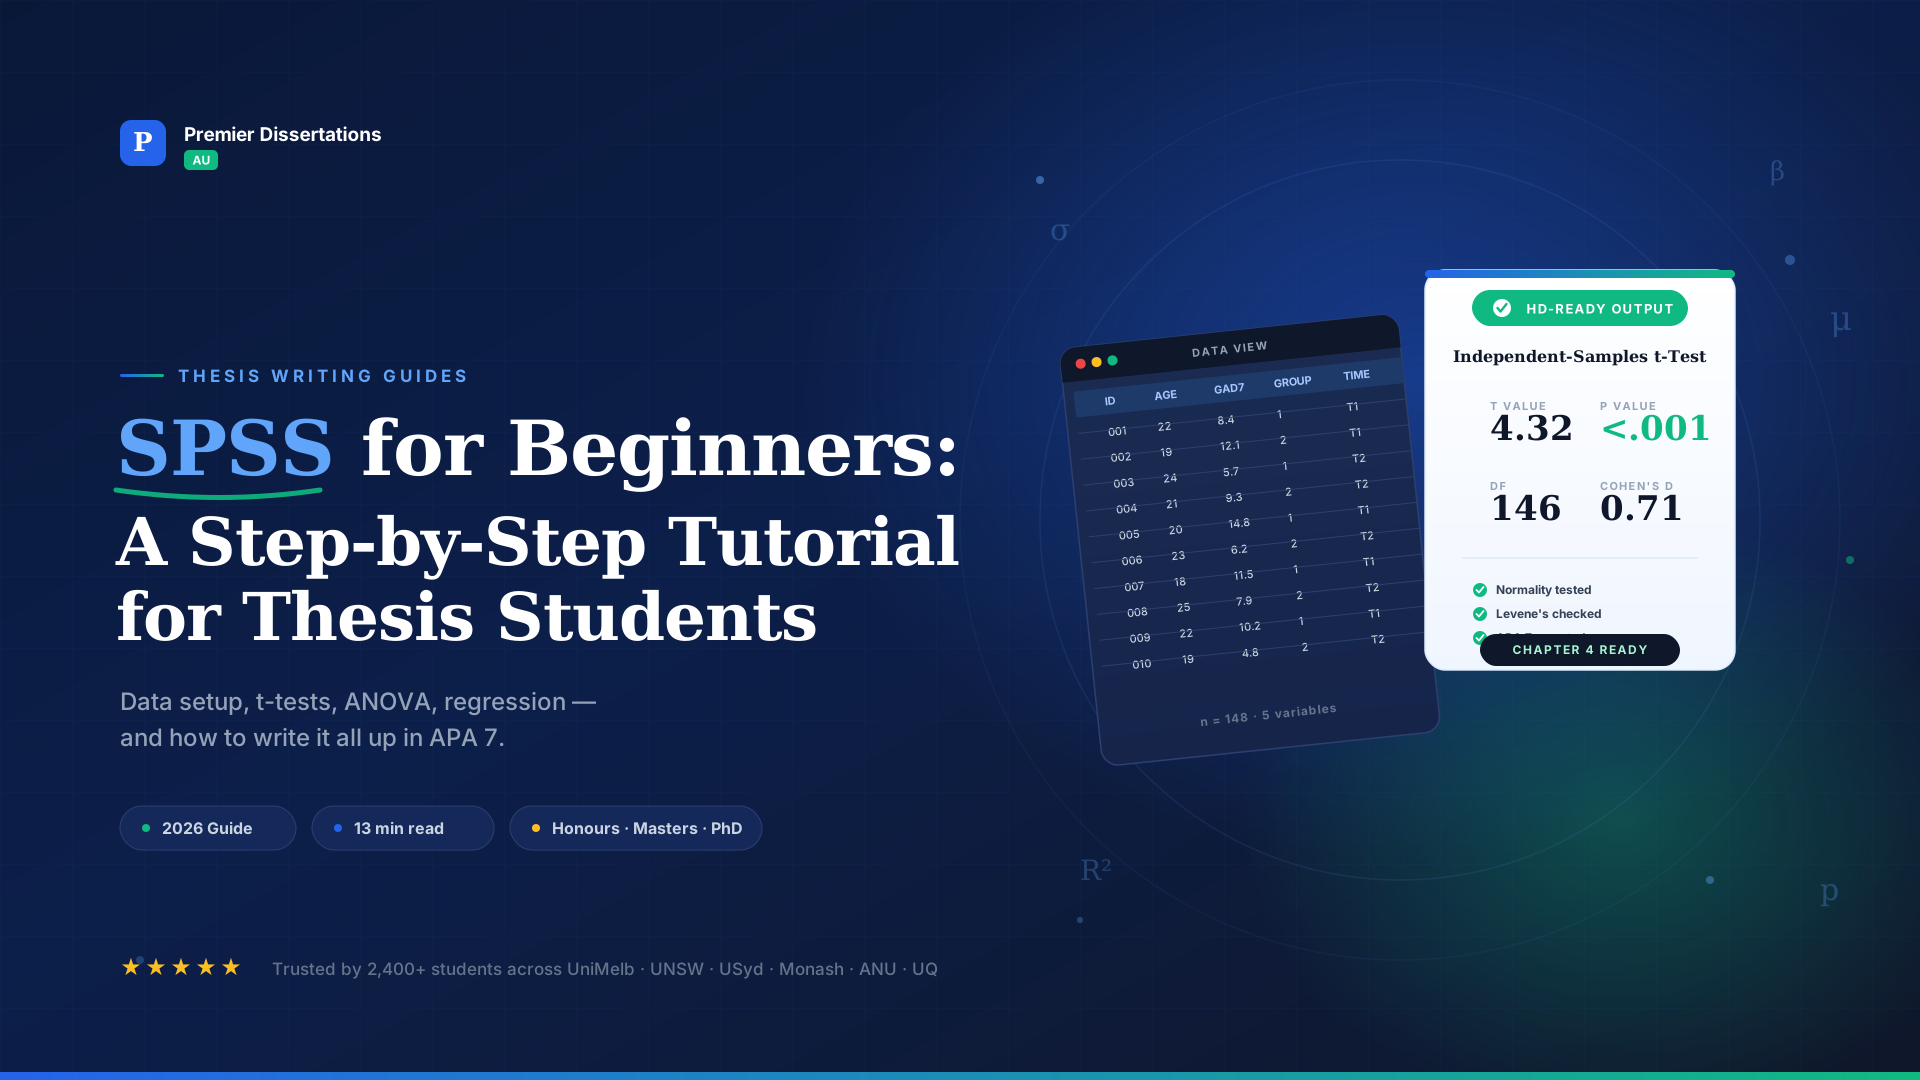
"An independent-samples t-test found that anxiety scores were significantly higher in the control group (M = 9.4, SD = 3.8) than the treatment group (M = 6.7, SD = 3.5), t(146) = 4.32, p < .001, d = 0.71."
Step 4: Comparing three or more groups — one-way ANOVA
Use when you're comparing means across three or more groups (e.g., anxiety across year levels: first-year, second-year, third-year).
Menu path: Analyze → Compare Means → One-Way ANOVA. Move the continuous variable into "Dependent List" and the grouping variable into "Factor". Under "Post Hoc", tick Tukey — this tells you which groups differ from each other if the overall test is significant.
APA 7 reporting example
"A one-way ANOVA revealed a significant effect of year level on anxiety scores, F(2, 145) = 6.84, p = .001, η² = 0.09. Tukey post-hoc comparisons indicated that first-year students (M = 9.8, SD = 4.0) scored significantly higher than third-year students (M = 6.9, SD = 3.4, p < .001)."
Step 5: Testing relationships — correlation and regression
For the strength of a relationship between two continuous variables, use correlation: Analyze → Correlate → Bivariate. Pearson's r is the default for normally distributed variables.
For predicting one continuous variable from one or more others, use regression: Analyze → Regression → Linear. Move your outcome into "Dependent" and your predictors into "Independent(s)".
Regression assumptions to document:
- Linearity: scatterplot of predictor against outcome.
- No multicollinearity: VIF values below 5 (below 10 at worst).
- Independence of residuals: Durbin-Watson between 1.5 and 2.5.
- Homoscedasticity and normality of residuals: visible in the standardised residual plots SPSS produces on request.
APA 7 reporting example
"A multiple regression predicting anxiety scores from workload and social support was significant, F(2, 145) = 14.32, p < .001, R² = .17. Workload was a positive predictor (β = 0.34, p < .001), while social support was a negative predictor (β = −0.21, p = .008)."
Reporting your results in APA 7 style
Never paste SPSS output tables directly into your thesis. Reformat them into APA 7 style tables — no vertical lines, minimal horizontal lines, and only the statistics your question needs. Australian examiners consistently mark down copy-pasted SPSS output.
The universal reporting rules:
- Report to two decimal places, three for p-values.
- Never write "p = .000" — write "p < .001".
- Italicise M, SD, n, t, F, r, p, R² — SPSS output doesn't do this, but APA requires it.
- Always include an effect size (Cohen's d for t-tests, η² for ANOVA, R² for regression).
- State your findings in plain words first, then the statistics in parentheses.
The mistakes that lose marks
- Running tests without checking assumptions. Every parametric test has assumptions. State them, test them, report them — even when they're met.
- Fishing for significance. Running twenty tests and reporting only the significant ones inflates your Type I error rate. Examiners spot this pattern immediately.
- Reporting p-values without effect sizes. A significant p tells you an effect exists; the effect size tells you if it's big enough to matter.
- Confusing statistical significance with practical significance. With a large enough sample, a trivially small effect becomes statistically significant. Say so if that's what happened.
- Copy-pasting SPSS output tables into the thesis. Reformat everything to APA 7. This alone can lift a Chapter 4 grade by a full band.
Frequently asked questions
Where do I get SPSS if my university doesn't provide it?
Almost every Australian university licences SPSS for enrolled students through the library or IT portal. If yours is the rare exception, Jamovi is a free open-source alternative that mirrors SPSS's interface and produces publishable analyses.
How do I know which test to run?
Match your research question to the test type: comparing two groups → t-test; comparing three or more → ANOVA; measuring a relationship → correlation; predicting an outcome → regression. If your outcome variable is categorical rather than continuous, you'll need chi-square or logistic regression instead.
What sample size do I need?
Run a power calculation before recruitment using G*Power (free software). Rule-of-thumb minimums are ~30 per group for t-tests and ANOVA, and roughly 10–15 participants per predictor for multiple regression, but always justify your specific sample against your effect-size assumptions.
My data isn't normally distributed — now what?
Use non-parametric equivalents: Mann-Whitney U instead of the t-test, Kruskal-Wallis instead of ANOVA, Spearman's rho instead of Pearson's r. Report the departure from normality honestly and explain your choice.
Should I use R instead of SPSS?
R is more powerful and free, but has a steep learning curve. For an Honours thesis, SPSS is usually the pragmatic choice. For PhD work or careers in research, learning R is a strong long-term investment.
How do I keep track of what I've done in SPSS?
Save the syntax file every time. Every menu action in SPSS generates syntax code; keeping this creates a permanent audit trail of your analysis and lets you replicate everything if you find an error later. Examiners increasingly ask for syntax files as evidence.
Stuck on your SPSS analysis?
Premier Dissertations AU runs the analysis, tests every assumption, and writes your results chapter in APA 7 with publishable tables — all from AUD $150 per package.
Get a Free Quote