


Civil Engineering Construction
February 16, 2021
Bridge Design Analyses
February 26, 2021
From attachment 9:
Questions: What is the Centenary Quay project? What is the CHP system, and how does it Work? Why was it installed for this project? What are its benefits and performance? What are the design specifications etc…? How well is the energy system designed in the subject town? What are energy performances? How does the system work? What trends do the data show? How can the system be optimized? Why this system, and not any other? Where does the future lie etc...?
Project Introduction to Dwelling (Main contents in the report)
Introducing how the land is divided in the Centenary Quay project will be presented. The introduction of the natural gas-fired Combined Heat and Power (CHP) plant, the system sustainability and environmental impact will also be presented here. The discussion will be varied on design parameters including the air tightness with respect to the use of SAP. Heating system design discussions, specifications etc. Presenting the energy centre of Centenary Quay, the distribution system and efficiencies etc will be completed
From attachment 8:
Questions: What data is presented? Reflection on what the trends in unit consumption show with respect to various seasons/months. How does the consumption of the users change? Are there any similarities between different blocks of dwelling?
Data discussion
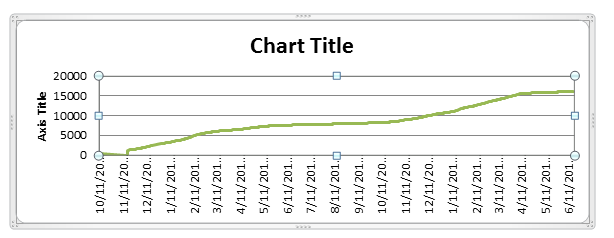
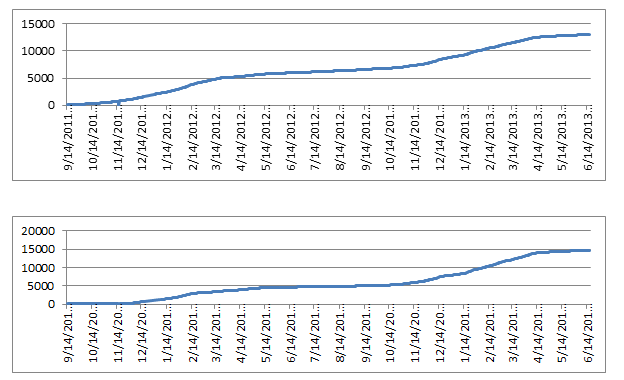
Data can be presented with respect to time and units, for various given meter numbers. Data can be accumulated for flats and home separations, and any differences noted will be discussed. Following shows how the trend works for flats for the first three meter numbers
The weather can also be discussed with respect to various elements given; however, the mean temperature would be a good presentation as shown below
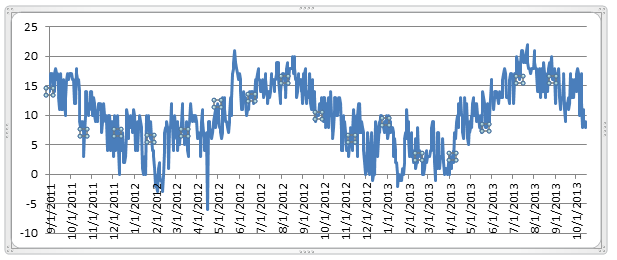
The temperature variations can be analyzed against the consumption rate against the same time interval/season
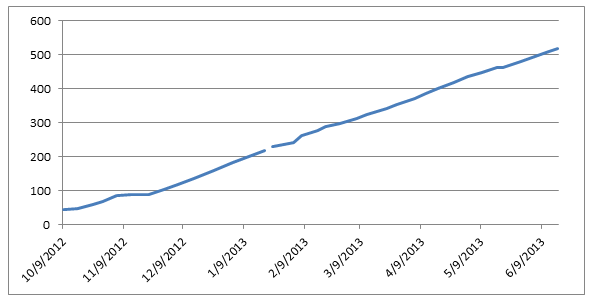
Further analyses can be conducted using the CHP KWh Taken from CHP Control Display against the time intervals/seasons such as the following
Other data can also be used to analyze relevant trends
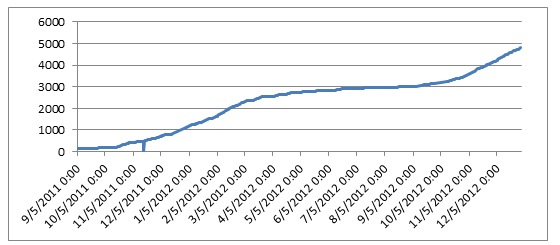
From attachment 7:
The data in this attachment is not in accordance with the meter ID. Some data can be used in the form of sections to describe the trends and see how energy consumption varies with time. Household heat meter data for Centenary Quay, for say the meter number 1010, for the years 2011 and 2012 can be analyzed to review the trend;
Other data can also be analyzed; however, there is so much data presenting such data would be very difficult.
From attachment 10:
This is a design tool, and detailed analyses will not be covered. Only an introduction will be presented, to show how the design parameters work in the form of the SAP tool
From attachments 11-12:
Details of the Plant will be presented using this file
From attachments 1-6:
It will only be used to attain background information